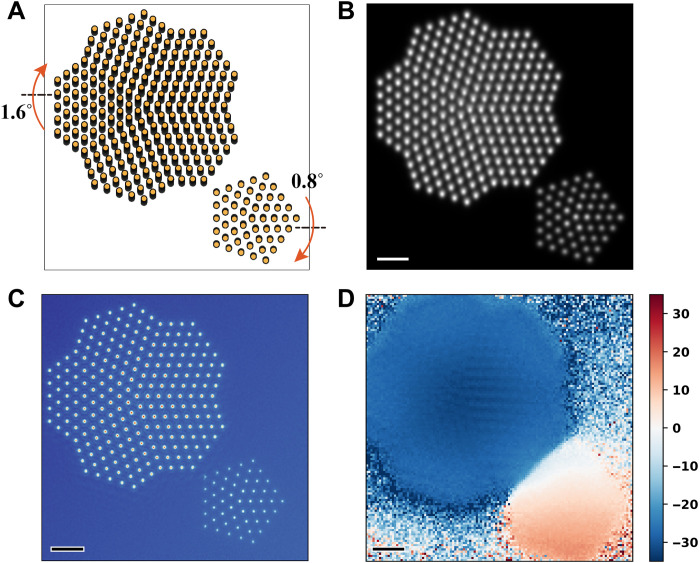
Fig. 6. Extended APP to image copper nanoparticles with different mistilts.
(A) Structure model of copper nanoparticles. (B) STEM-HAADF image. (C) Phase image averaged over all the four slices recovered via APP. (D) Recovered tilt map in the y direction in mrad. Scale bars, 1 nm. Poisson noise was added to the simulated CBED patterns corresponding to a dose of 1.2 × 10⁵ e/Å2.

