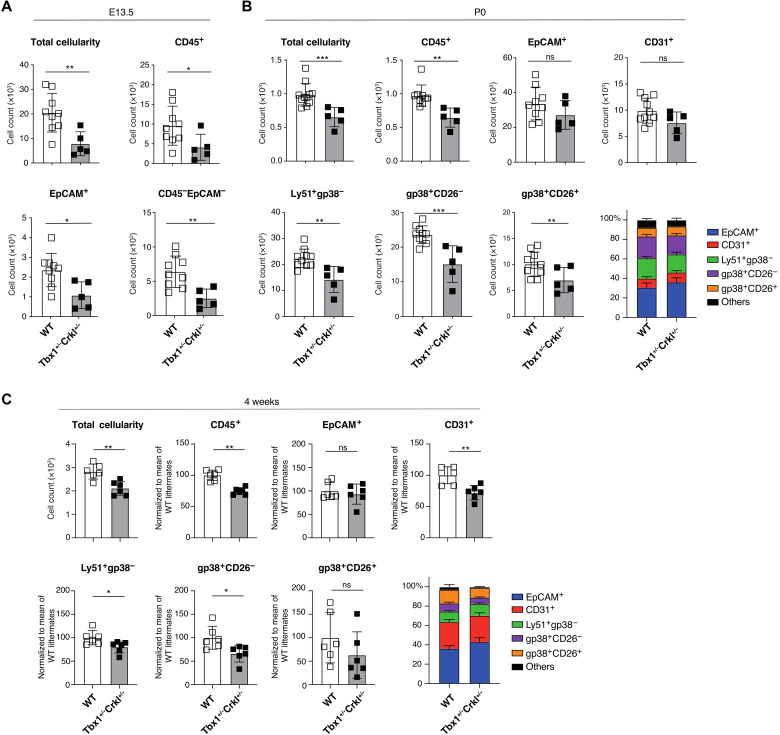
Fig. 4. Reduction of nonepithelial thymic stroma in Tbx1+/−Crkl+/− thymi.
(A) Total cellularity, number of CD45+, EpCAM+, and total mesenchymal cells (CD45−EpCAM−) at E13.5 WT (white bars, n = 9) and Tbx1+/−Crkl+/− (gray bars, n = 5) thymi. (B) Total thymic cellularity; absolute number of CD45+, EpCAM+, CD31+, Ly51+gp38−, gp38+CD26−, and gp38+CD26+ cells; and the frequency of stromal subpopulations in (B) neonatal (P0) and (C) 4-week-old WT (P0: n = 9, 4 weeks: n = 6) and Tbx1+/−Crkl+/− (P0: n = 5, 4 weeks: n = 6) mice. Data were normalized to the mean of WT littermates from two independent experiments (n = 3 for each experiment). Mean values are shown in the bar charts. Unpaired t test, *P < 0.05, **P < 0.01, and ***P < 0.001. ns, not significant.

