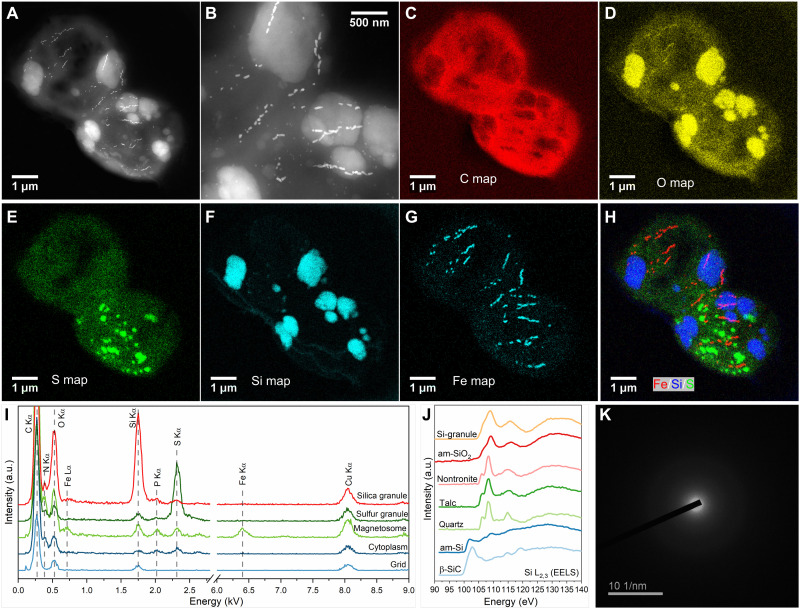
Fig. 2. Characterization of the magnetotactic strain WYHC-5 producing intracellular amorphous silica globules.
(A) STEM-HAADF image of two WYHC-5 cells. (B) High-magnification STEM-HAADF image of intracellular particles and granules from the cells shown in (A). (C to H) STEM-EDXS elemental maps of WYHC-5 cells shown in (A). (C) Carbon (C Kα). (D) Oxygen (O Kα). (E) Sulfur (S Kα). (F) Silicon (Si Kα). (G) Iron (Fe Kα). (H) Red-green-blue map of Fe (red), Si (blue), and S (green). (I) STEM-EDX spectra obtained on different regions of interest: silica granule, sulfur granule, magnetosome, cytoplasm, and TEM grid. a.u., arbitrary unit. (J) TEM-based electron energy loss spectrum (EELS) measured at Si L2,3 edges on an intracellular silicon-rich granule (Si-granule). This spectrum is compared with spectra of reference β-silicon carbide (β-SiC), pure amorphous Si (am-Si), quartz, talc, nontronite, and amorphous silica (am-SiO2). (K) SAED pattern of an intracellular silicon-rich granule.

