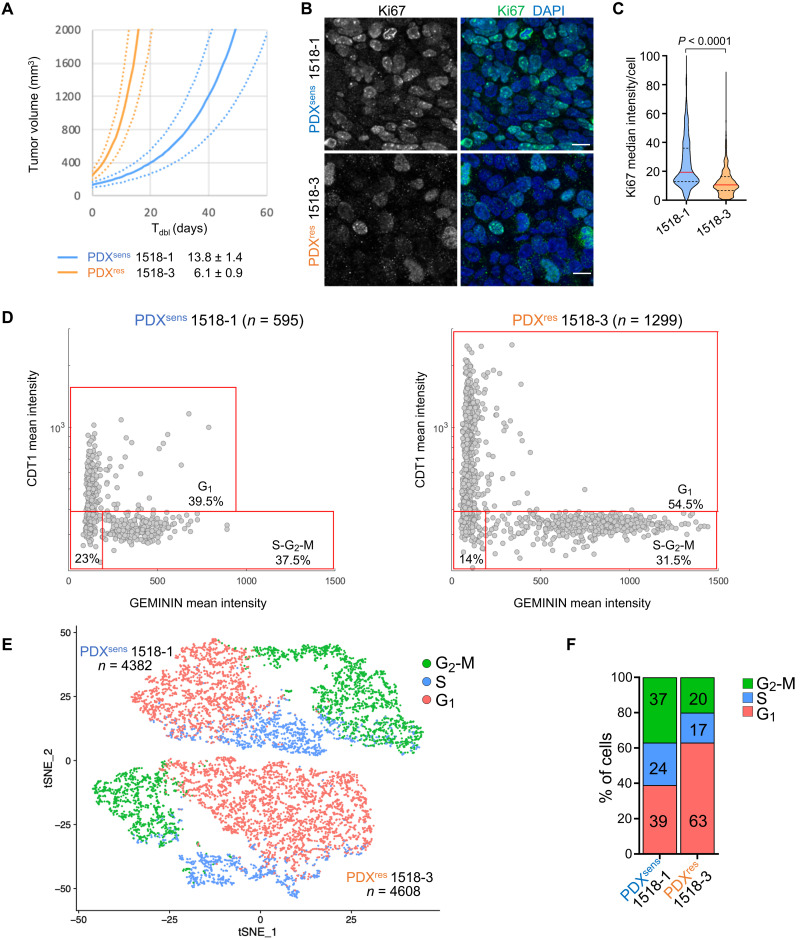
Fig. 3. PDXres 1518-3 tumors are enriched for cells with cell cycle properties that differ from PDXsens tumor cells.
(A) Average growth curves for indicated models (solid), with SE estimates (dashed). Growth rates extrapolated from exponential regressions of tumor-volume measurements from 9 to 10 untreated xenografts. Model doubling times indicated in legend. (B) Ki67 (cell marker for active proliferative state) was immunodetected on xenograft tissue sections of the indicated models, and nuclei were detected by DAPI. Scale bars, 10 μm. (C) Truncated violin plot showing Ki67 median fluorescence intensity per cell; median values are indicated by red horizontal lines (19.4 for 1518-1 and 10.6 for 1518-3) and quartiles by black dashed lines. Data from two independent experiments are shown, and statistical analysis was performed with two-tailed Mann-Whitney test. Apoptotic cells were identified by TUNEL assay (staining not shown) and excluded from the quantification. Numbers of analyzed cells are as follows: 1518-1 n = 1402; 1518-3 n = 988. (D) CDT1 (cell cycle G1 phase marker) and GEMININ (cell cycle S-G2-M phase marker) were immunodetected on tumor tissue sections of the indicated models, and nuclei were detected by DAPI. Plots show the mean fluorescence intensity of both CDT1 and GEMININ for each cell represented by a gray dot. Percentage of cells in the specific cell cycle phase is shown. (E) tSNE plot of scRNA-seq data showing the predicted cell cycle phase of each analyzed cell from the two MGH1518 models. Each point represents a tumor cell. Prediction was performed using the Seurat CellCycleScoring package, and the percentages of cells in each cell cycle phase are shown in (F). (D and E) n indicates the number of analyzed cells for each PDX model.

