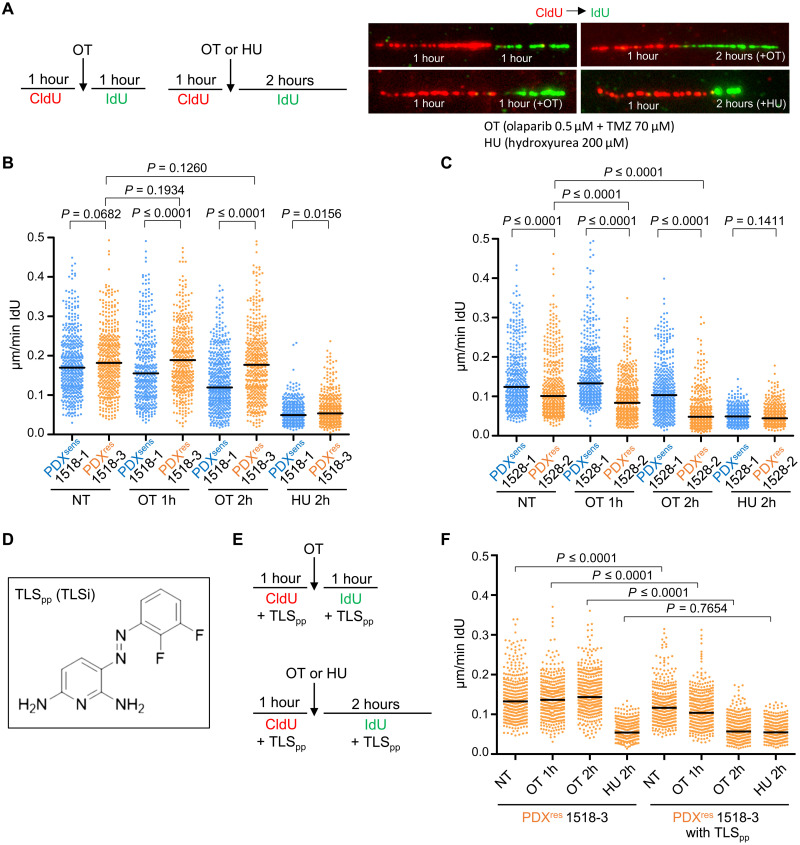
Fig. 6. DNA replication forks do not stall/collapse in the presence of OT in PDXres 1518-3 cells, and inhibition of TLS can revert this phenomenon.
(A and E) Schematic showing the experimental setup. Incorporated thymidine analogs CldU (5-chloro-2′-deoxyuridine) and IdU (5-iodo-2′-deoxyuridine) were labeled with two different fluorophores, red and green, respectively, in the absence of drug or during OT or HU treatment. (B, C, and F) Quantification of DNA replication fork speed under unchallenged condition or in the presence of OT or HU. IdU tracts were quantified, and newly fired origins or terminations (tracts with only one label) and replicon merging (second label tract surrounded by two first label tracts) were excluded from the quantification. Each dot represents one fiber, and fibers were quantified from two independent experiments. Median values are indicated by black horizontal lines, and NT indicates not-treated samples. Statistical analysis was performed with two-tailed Mann-Whitney test. Numbers of quantified fibers are as follows: 1518-1, NT n = 460, OT 1h n = 394, OT 2h n = 486, and HU 2h n = 409; 1518-3, NT n = 443, OT 1h n = 416, OT 2h n = 448, and HU 2h n = 410; 1528-1, NT n = 431, OT 1h n = 434, OT 2h n = 428, and HU 2h n = 407; 1528-2, NT n = 434, OT 1h n = 442, OT 2h n = 454, and HU 2h n = 409. (F) Numbers of quantified fibers are: 1518-3, NT n = 379, OT 1h n = 405, OT 2h n = 407, and HU 2h n = 407; 1518-3 with TLSpp, NT n = 391, OT 1h n = 389, OT 2h n = 441, and HU 2h n = 408. (D) Chemical structure of the novel TLS inhibitor (TLSpp).

