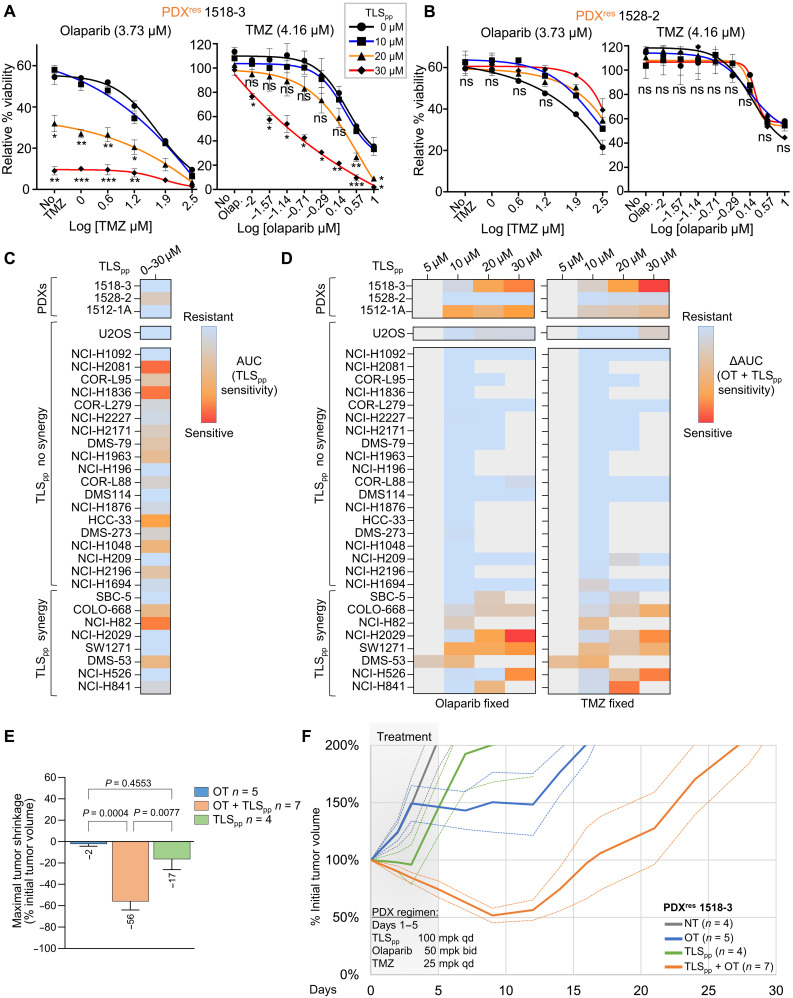
Fig. 7. TLS inhibitor synergizes with OT and induces cell death in PDXres 1518-3 SCLC cells.
(A and B) Cell survival assays with either PDXres 1518-3 (A) or PDXres 1528-2 (B) treated with OT at indicated concentrations, in the presence of TLSpp (blue, orange, and red curves) or without TLSpp (black curve). Left: Cell viability when treated with a fixed concentration of olaparib and increasing concentration of TMZ. Right: Cell viability when treated with a fixed concentration of TMZ and increasing concentration of olaparib. Data represent the mean percentages of survival from at least two independent experiments. Statistical analysis was calculated with one-way ANOVA Tukey multiple comparisons, and all P values are described in the “Statistical analysis” section. (C and D) Heatmaps showing the sensitivity of SCLC cells to TLSpp single-agent treatment (C) and in combination with OT (D). Explanatory figure legends for AUC (area under the curve) and ΔAUC calculations are in fig. S8 (B and C). (E) Bar graph showing tumor shrinkage in PDX models treated with different regimens. Mean and SEM bars are shown, and regimens are indicated in the legend. Statistical analysis was calculated with one-way ANOVA Tukey multiple comparisons, and P values are shown. n indicates the number of xenografts analyzed for each regimen. (F) Solid curves represent the mean % ITV versus time (days) after a single cycle (days 1 to 5) of TLSpp (100 mpk qd), OT (Ola 50 mpk bid + TMZ 25 mpk qd), or TLSpp + OT. Dashed curves represent tumor volume curve ± SEM. Numbers of replicate xenografts per regimen are represented parenthetically. Grayed area represents the treatment cycle.

