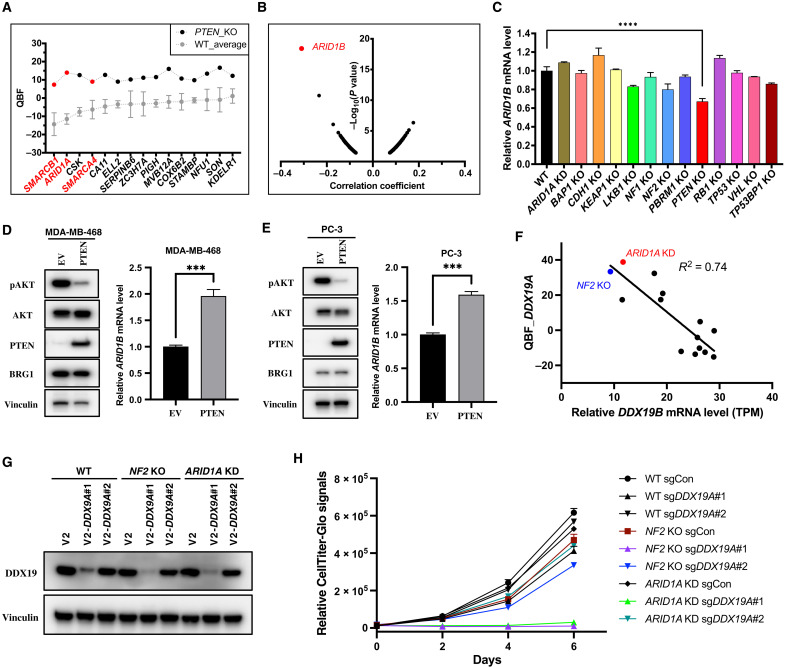
Fig. 4. Essential paralogs underlying SL.
(A) QBF of high-confidence SL hits for PTEN KO cells. WT_Average means the mean QBF of all four repeated WT screens and is presented as means ± SD. (B) Pearson correlation analysis of gene dependency for ARID1A-mutant features in all available cell lines in the DepMap portal. (C) Relative mRNA levels of ARID1B in 293A WT and all TSG KO cells. Data are presented as means ± SD of two biological replicates. Statistical analysis was performed with one-way ANOVA. ****P < 0.0001. (D) EV- or PTEN-overexpressed MDA-MB-468 cells were seeded at 4 × 10⁵ cells per well in a six-well plate and maintained for 48 hours, and then cells were harvested for immunoblotting with the indicated antibodies or real-time quantitative PCR to measure the mRNA levels of ARID1B. Data are presented as means + SD of three biological replicates with statistical analysis by unpaired t test. ***P < 0.001. (E) Same conditions described in (D), except that the cell line was PC-3. (F) Negative correlation between DDX19B expression and DDX19A essentiality. TPM, transcripts per kilobase million. (G) 293A WT, NF2 KO, and ARID1A KD cells were infected with lentiviruses containing LentiCRISPRv2 sgControl or two independent sgRNAs targeting DDX19A; 24 hours later, cells were selected with puromycin (2 μg/ml) for 3 days and harvested for immunoblotting with the indicated antibodies. (H) Same conditions described in (G), except that the cells after puromycin selection were seeded at 800 cells per well in a 96-well plate with four replicates, and luminescence detection was performed every 2 days according to the standard protocol.

