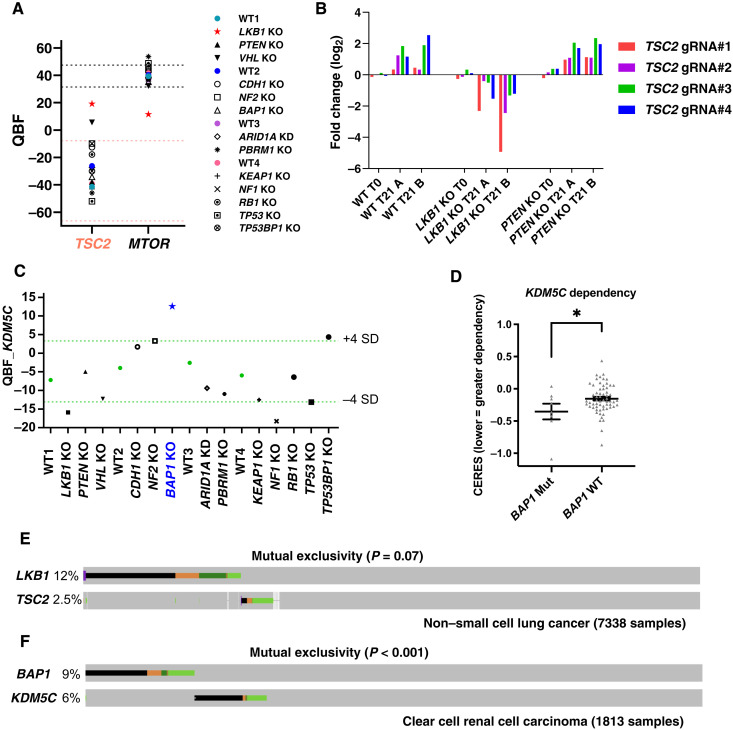
Fig. 5. Tumor suppressors could be potential anticancer targets in certain cancers.
(A) Relative essentiality of TSC2 and mTOR in 293A WT and TSG KO cells as shown by QBF. Light red dashed line indicates the range of the mean QBF_TSC2 from all four WT screens ± 3 × SD. Black dashed line indicates the range of the mean QBF_mTOR from all four WT screens ± 3 × SD. (B) gRNA fold changes of TSC2 in 293A WT, LKB1 KO, and PTEN KO cells. (C) KDM5C gene dependency in 293A WT and TSG KO cells as shown by QBF. Light green dashed line indicates the range of the mean QBF_KDM5C from all four WT screens ± 4 × SD. (D) KDM5C KO effects inferred by the CERES dependency scores were compared in 67 breast and kidney cancer cell lines grouped by BAP1 mutation status using data from the DepMap portal. Data are presented as means ± SEM and analyzed with an unpaired t test. *P < 0.05. (E) Oncoprint displaying mutational landscapes of LKB1 and TSC2 in patients with non–small cell lung cancer on cBioPortal. Copy number alterations were not included in this analysis. Alteration colors are the same as those shown in cBioPortal. Data were retrieved on 1 August 2021. (F) Oncoprint displaying mutational landscapes of BAP1 and KDM5C in patients with ccRCC on cBioPortal. Other conditions are the same as in (E).

