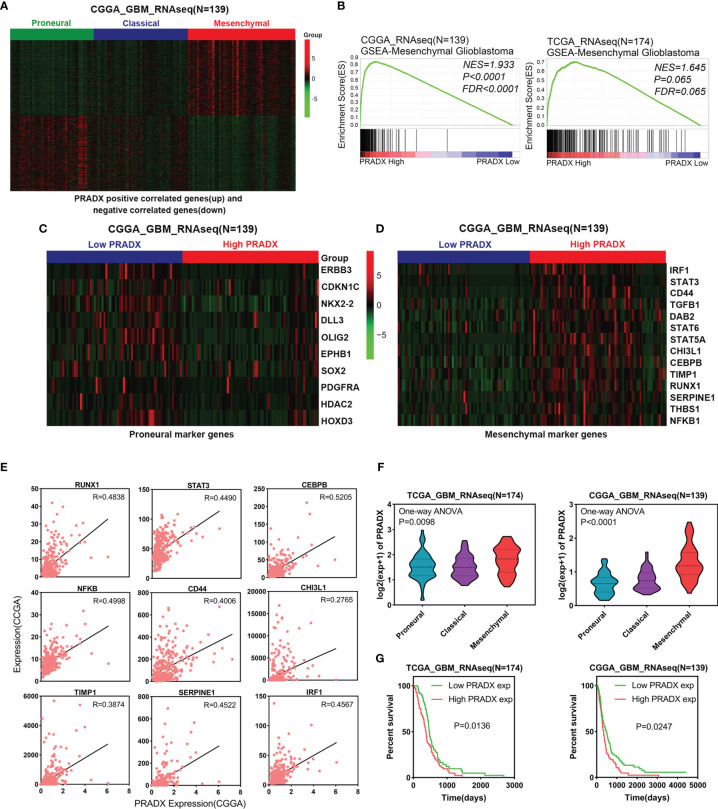
Figure 1.
PRADX expression correlates with mesenchymal GBM. (A) Clustered heat map showing that PRADX positively correlated genes (top 500) and negatively correlated genes (top 500) expression profiles in the CGGA database. (B) GSEA analysis of mesenchymal GBM gene expression between PRADX high and low expression groups in TCGA and CGGA databases. (C, D) Clustered heat map showing that proneural and mesenchymal marker genes expression profiles in PRADX high expression and low expression patients. (E) The correlation between PRADX and mesenchymal marker genes in the CGGA database. (F) Violin plots exhibiting PRADX expression in different molecular subtypes of GBM in TCGA and CGGA databases. (G) Kaplan-Meier curve showing patients’ survival times between PRADX high expression and low expression groups.

