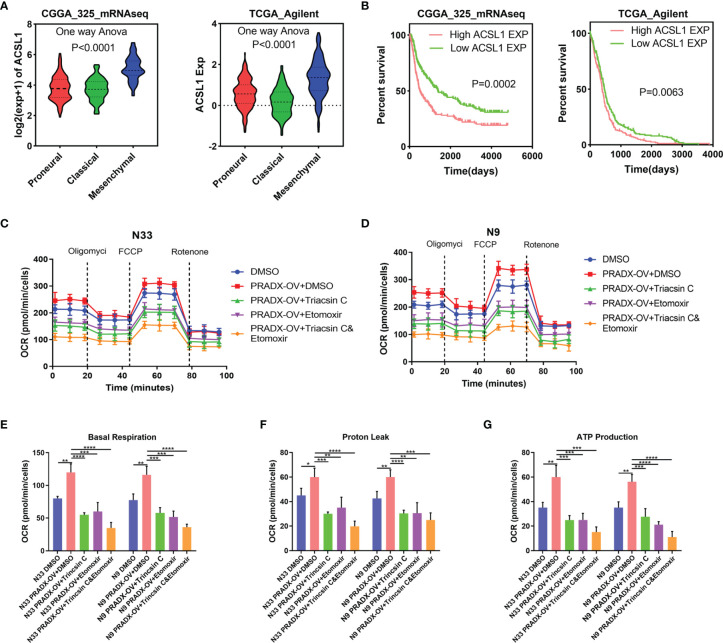
Figure 6.
PRADX enhances energy metabolism via increasing ACSL1 in glioma. (A) Violin plots showing ACSL1 expression in different molecular subtypes of GBM in TCGA and CGGA databases. (B) Kaplan-Meier curve showing patients’ survival times between ACSL1 high expression and low expression groups. (C, D) The time series for the oxygen consumption rate (OCR) was measured by a seahorse analyzer in the indicated groups. (E–G) OCR measurement of basal respiration, proton leak, and ATP production for these five groups above. The values in (C–G) are represented as mean ± SD (n = 3). *P <0.05, **P < 0.01, ***P < 0.001, ****P <0.0001.

