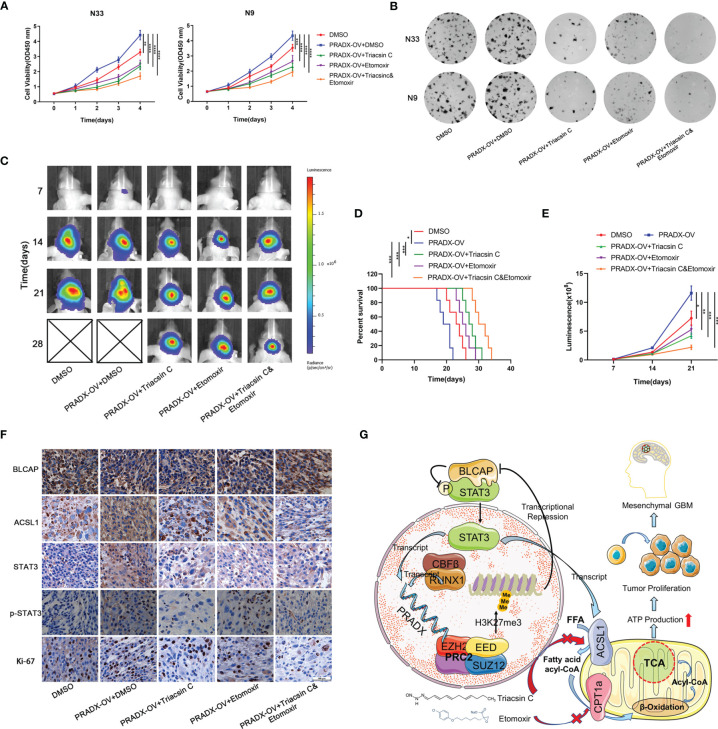
Figure 7.
Triacsin C and Etomoxir reduce PRADX-mediated tumorigenesis in vitro and in vivo. (A) CCK8 assays show the effect of PRADX overexpression and the Triacsin C and Etomoxir on cell viability. (B) Colony formation assays show the effect of PRADX overexpression and the Triacsin C and Etomoxir on the tumor cell growth of the indicated five groups, representative images are shown. (C) Nude mice were orthotopically injected with PRADX overexpression or scramble TBD0220 cells. Representative luminescence images at 7,14,21 and 28d after injection are shown. (D, E) Kaplan-Meier survival curve and quantification of bioluminescence signal intensities at 7,14, and 21d post-injection are shown. (F) IHC of tumor tissues from nude mice xenograft models showing BLCAP, ACSL1, STAT3, p-STAT3, and Ki-67 expressions in the five groups. (G) Scheme showing PRADX-EZH2 interaction-mediated recruitment of H3K27me3 and regulation of STAT3 activity, promoting mesenchymal GBM tumorigenesis. The values in A are represented as mean ± SD (n = 3). *P < 0.05, **P < 0.01, ***P < 0.001, ****P <0.0001.

