
Figure 2.
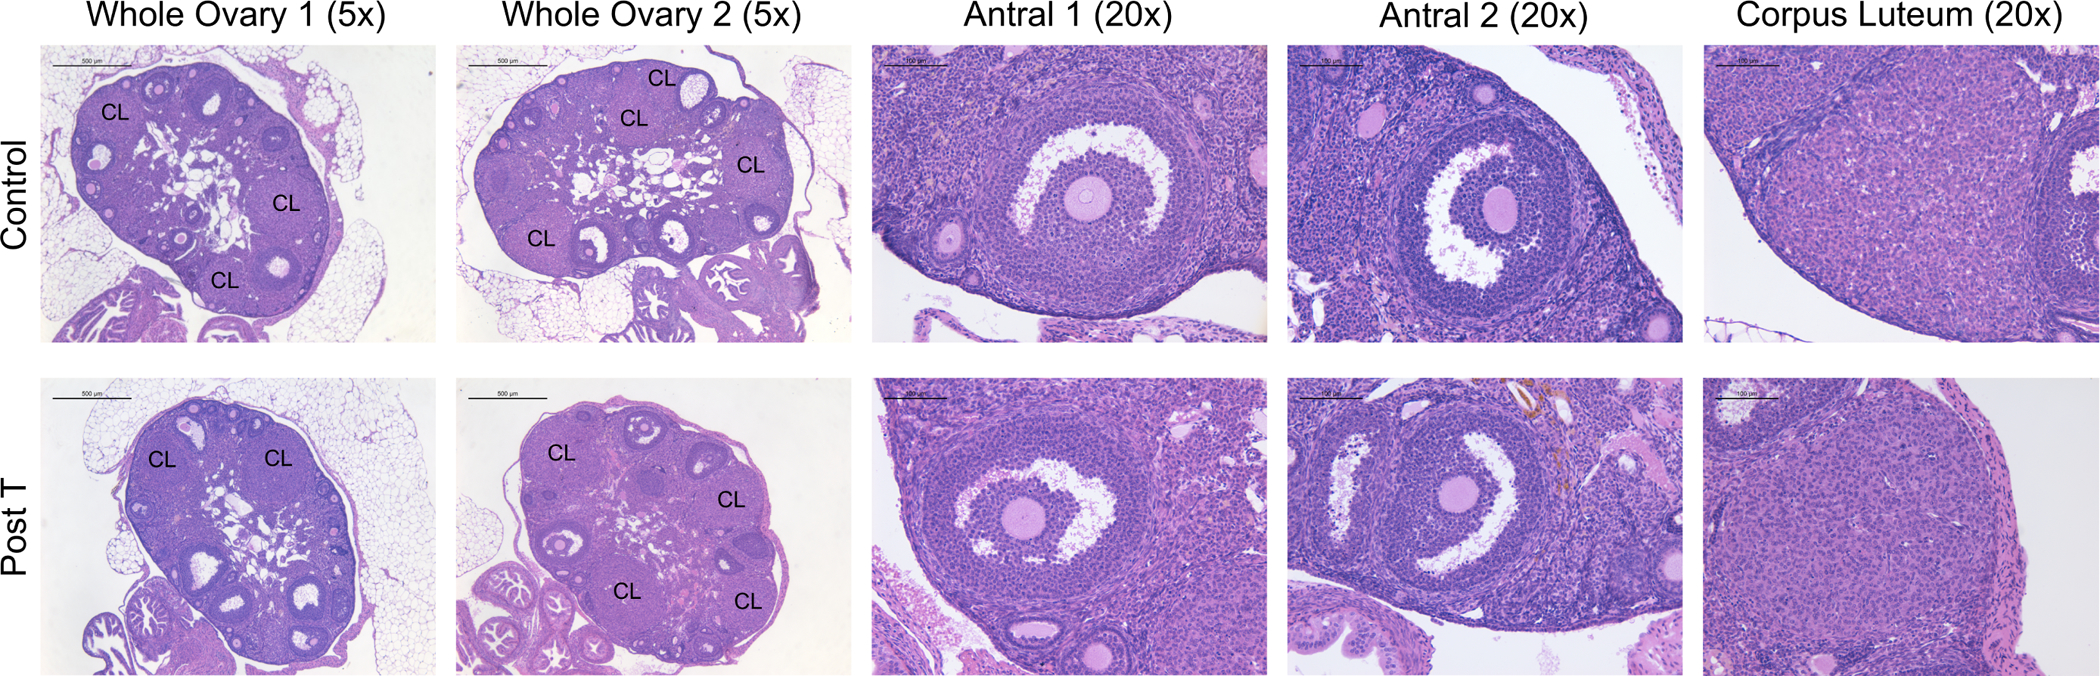
Comparable Ovarian Histology. Corpora lutea were noted in both control ovaries (row 1) and post T ovaries (row 2) (columns 1 and 2, 5x, hematoxylin and eosin stain, scale 500 μm). Post T mice were sacrificed after T cessation and 4 estrous cycles. Examples of higher magnification antral follicles (Columns 3 and 4, 20x, scale 100 μm) and corpora lutea (Column 5, 20x, scale 100 μm) for control ovaries (row 1) and post T ovaries (row 2).