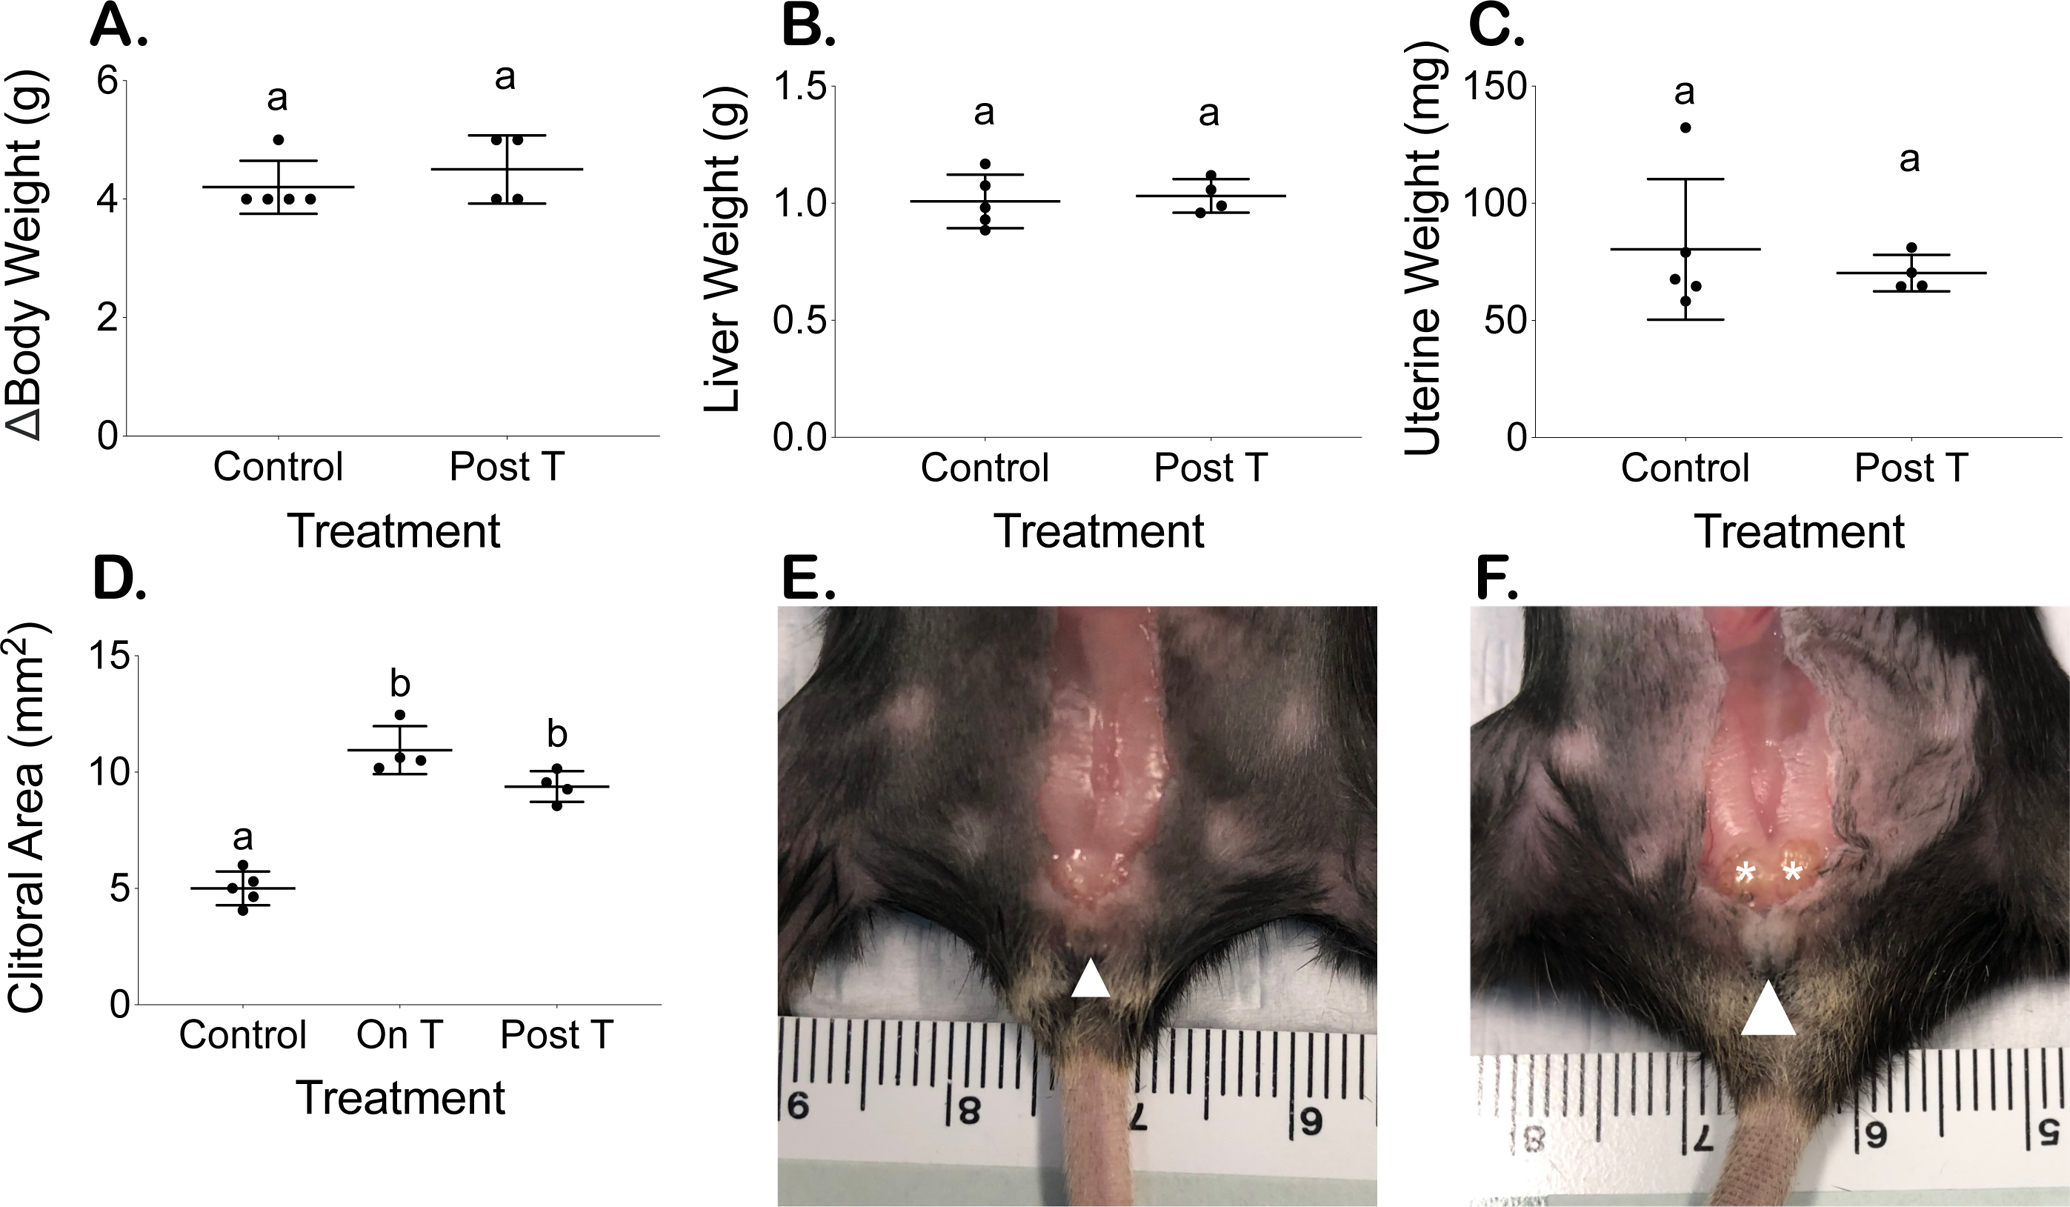
Figure 4.

Terminal body measurements comparable except for persistent clitoromegaly. (A) Body weight increase over approximately 9 weeks, (B) terminal liver weight (normalized to terminal average of 22.9 g mouse), and (C) terminal uterine weight (normalized to terminal average of 22.9 g mouse) (mean ± SD). Increased clitoral area measured at 6 weeks on T remains persistently elevated 4 estrous cycles following T cessation (D) (mean ± SD). Clitoral size remains enlarged in post T mice (F) compared to control mice (E) with white arrowheads identifying clitoral structure and asterisks indicating glands enlarged by T therapy that are not readily visible in the control.
