. 2022 Apr 22;11:e72313. doi: 10.7554/eLife.72313

Figure 1. Genetic screen identifies modulators of B cell expansion and plasma cell accumulation.

(A) Dot plot representation of genetic screens of B cell proliferation/survival, and CD138 + cell accumulation: X-axis shows z-score of gene-level log2 fold change (LFC) for CD138 + cell accumulation (CD138 +v CD138- cells) and Y-axis shows z-score of gene-level LFC (day 8 v day 4 cells) for B cell expansion calculated by MAGECK. (B) Top: Distribution of enrichments of all sgRNAs (z-scores of sgRNA-level LFC: CD138 +v CD138- cells) for the CD138 + cell accumulation screen. Bottom: Enrichment for each of the ten sgRNAs, represented as red lines, targeting one of the indicated genes in comparison to the overall distribution of sgRNAs in the screen, depicted as the grey density in the middle of each bar. (C) The ratio of the proportion of cells expressing CD138 in Cas9 + cells and Cas9- cells transduced by viruses with non-targeting (NT), Prmd1, Bach2, Csde1, Strap, Eif3k, Eif3l targeting sgRNAs at day-8 of the in vitro B cell culture the data are representative of between two and four experiments performed on different days. Statistical significance was determined by two-tailed unpaired Student’s t-test, p values unadjusted for multiple testing are plotted. Each symbol is representative of a distinct sgRNA. (D) Same as in (A) with additional genes highlighted. (E) Same as in (B) with additional genes highlighted. (F) Same as in (C) with Ythdf2, Mettl3, Tnrc6a, Cnot9 targeting sgRNAs and paired sgRNAs against Cnot10/Cnot11. the data are representative of between two and four experiments performed on different days. (G) Left: representative flow cytometry for Ythdf2 CTL and Ythdf2 CKO and right: summary data of the proportion of cells expressing CD138 at day 8 of an in vitro culture of B cells from Ythdf2fl/fl mice (closed circles) or Ythdf2fl/fl-Vav1-iCre mice (open squares); the data are representative of three experiments performed on different days. Statistical significance was determined by two-tailed unpaired Student’s t-test. Each symbol is representative of cells from a single mouse.

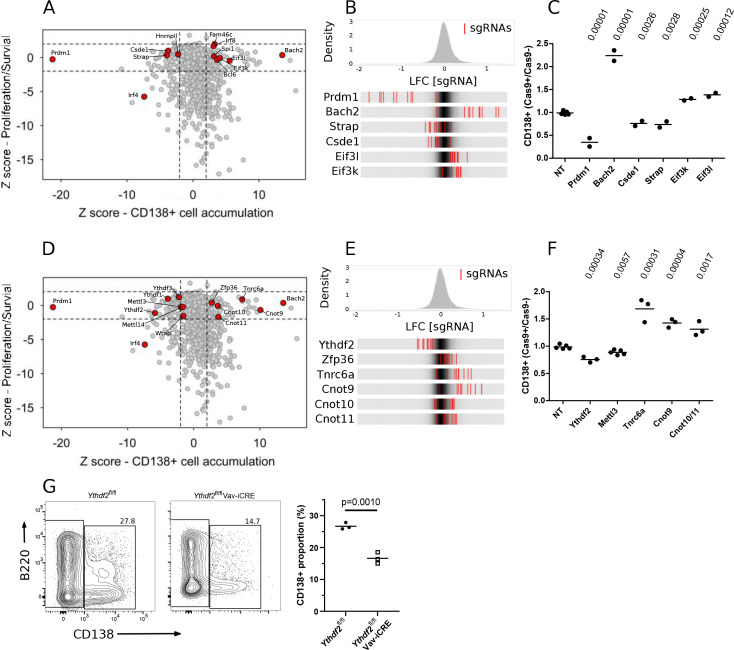
Figure 1.

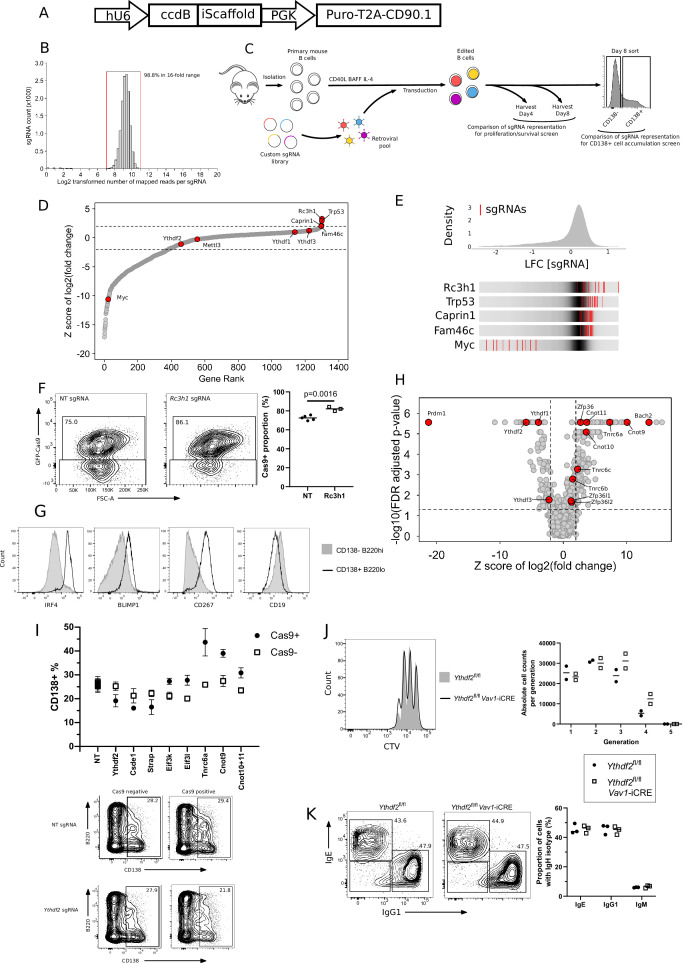
Figure 1—figure supplement 1. Custom sgRNA library targeting RBPs identifies regulators of B cell proliferation and survival.

Figure 1—figure supplement 1.

(A) Schematic representation of the vector for the custom sgRNA library. (B) Distribution of the relative representation of sgRNAs within the sgRNA library. Red vertical lines indicate the upper and lower bounds of a 16-fold range in representation that includes 98.8% of all sgRNAs. (C) Schematic representation of the pooled CRISPR/Cas9 knockout screens in primary mouse B cells. Comparison of sgRNA representation between day 4 and day 8 identified genes involved in proliferation and/or survival. Comparison of representation between day 8 cells sorted as CD138 +ve or -ve identified genes promoting or inhibiting plasma cell accumulation. (D) Enrichment plot for the proliferation and/or survival screen. The Y-axis shows z-score of gene-level log2 fold change (LFC) (day 8 v day 4 cells). X-axis shows rank of genes by z-score of gene-level LFC. (E) Top: Distribution of enrichments of all sgRNAs (z-scores of sgRNA-level LFC: day 8 v day 4 cells) for the B cell proliferation and/or survival screen. Bottom: LFC (day 8 v day 4 cells) for all ten sgRNAs targeting the indicated genes. The grey gradient in the middle of each bar depicts the overall distribution. Red lines represent individual sgRNAs targeting a given gene. (F) Left: Representative flow cytometry and right: quantification of the proportion of cells in coculture that are expressing Cas9-GFP at day 8 of an in vitro culture. Each symbol represents an individual non-targeting (NT) sgRNA (closed circles) or Rc3h1 sgRNA (open squares). Statistical significance was determined by two-tailed unpaired Student’s t-test. (G) Representative flow cytometry of B220hi CD138- or B220lo CD138 +in vitro derived cells for expression of IRF4, BLIMP1, CD267 and CD19. (H) Volcano plot representation of CRISPR/Cas9 screen of plasma cell accumulation. X-axis shows z-score of gene-level LFC (CD138 +v CD138- cells) and the Y-axis shows FDR adjusted p-value calculated by MAGECK. (I) Top: The percentage of Cas9 +and Cas9- cells expressing CD138 transduced by viruses with non-targeting (NT), Ythdf2, Csde1, Strap, Eif3k, Eif3l, Tnrca, Cnot9 sgRNAs or paired sgRNAs against Cnot10/Cnot11 at day-8 of the in vitro B cell culture. The data are representative of between two and four experiments performed on different days. Each symbol is representative of a distinct sgRNA. Bottom: Representative flow cytometry showing B220 and CD138 staining of GFP+ (Cas9 expressing) and GFP- (Cas9 non-expressing) cells at day 8 of an in vitro culture following transduction with viruses expressing non-targeting sgRNA or sgRNA targeting Ythdf2. (J) Left: representative flow cytometry analysis of cell trace dilution of 72 hr anti-IgM stimulated B cells. Right: Enumeration of absolute cell number per generation. (K) Left: representative flow cytometry analysis for Ythdf2 CTL and Ythdf2 CKO of the proportions of cells expressing IgG1 and IgE at day 8 of an in vitro culture. Right: Quantification of the proportion of cells expressing each IgH isotype.