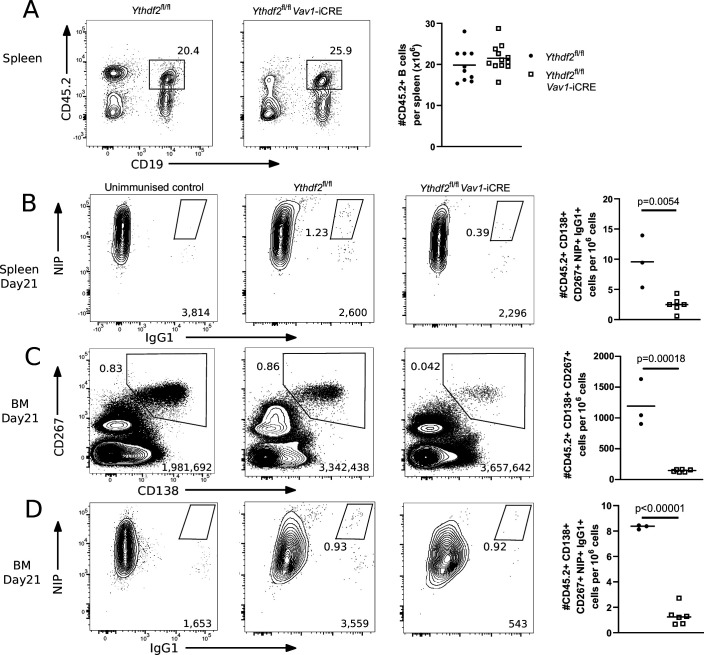
Figure 3. YTHDF2 deficient plasma cells fail to accumulate in the bone marrow.
(A) Left: Representative flow cytometry analysis of cells expressing CD45.2 and CD19 in spleen of competitive chimeras twelve weeks after reconstitution. Numbers refer to the proportion of viable single cells within CD45.2 + CD19 + gate. Right: The number of cells expressing CD45.2 and CD19, n ≥ 10. (B) Representative flow cytometry analysis of NIP and IgG1 intracellular staining on spleen cells gated as CD45.2 + CD138+, CD267 + cells at day 21. (C) Representative flow cytometry analysis of CD138 and CD267 staining on bone marrow cells gated as CD45.2 + at day 21. (D) Representative flow cytometry analysis of NIP and IgG1 intracellular staining on bone marrow cells gated as CD45.2 + CD138+, CD267 +at day 21. For each condition, the numbers in the bottom right corner of left-hand panels show the number of events plotted. The numbers adjacent to the gates indicate the proportion of cells within the gate. For each condition, the right-hand plots show the number of cells per million viable cells. Symbols represent data from an individual Ythdf2fl/fl control (closed circles, n = 3) and Ythdf2fl/fl-Vav1-iCre knockout (open squares, n = 6) mouse. Statistical significance was determined by two-tailed unpaired Student’s t-test. The data are from a single immunisation experiment.


