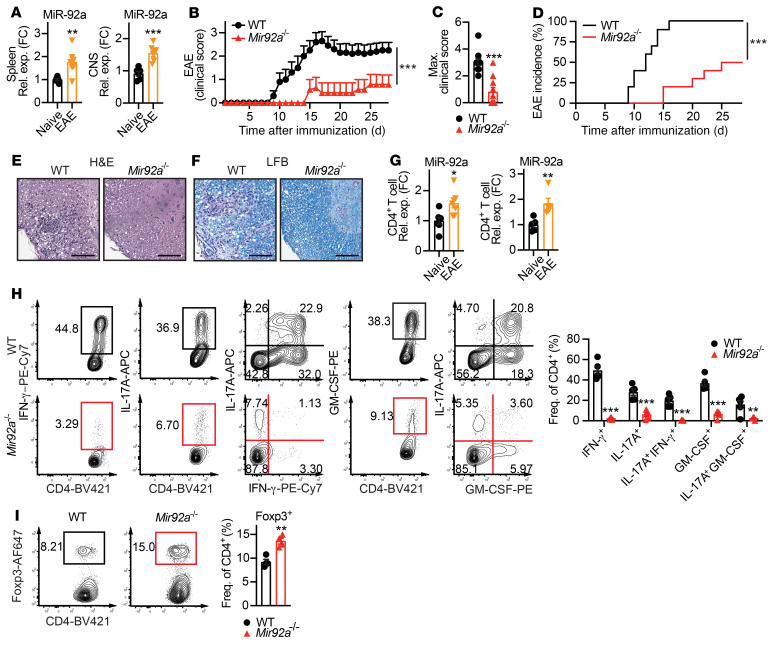
Figure 1. Mir92a–/– mice develop attenuated EAE.
(A) qPCR analysis of miR-92a in total splenocytes (spleen, left) and spinal cords (CNS, right) from WT mice at EAE onset (n = 6–7). (B) Clinical EAE scores for WT and Mir92a–/– mice (n = 9–10) via standardized EAE clinical scale for ascending paralysis from 0–5 on each day during the observation period for each mouse. (C) Maximum (Max.) EAE clinical scores reached for each individual WT and Mir92a–/– mouse (n = 9–10) during the observation period from B. (D) Percentage of disease incidence for WT and Mir92a–/– mice (n = 9–10) on each day during the observation period from B. (E and F) Representative histopathological sections of spinal cords from WT and Mir92a–/– mice at peak EAE, showing immune cell infiltration via H&E staining (E) and demyelination via LFB staining (F). Scale bars: 100 μm. Original magnification, ×100. (G) qPCR analyses of miR-92a in splenic CD4+ T cells from naive WT mice versus that in EAE WT mice (n = 7) (left) and miR-92a in splenic CD4+ T cells from naive WT mice versus CNS-infiltrating CD4+ T cells from EAE WT mice (n = 5) (right). FC, fold change. (H) Representative flow cytometric plots (left) and frequencies (right) of IFN-γ+, IL-17A+, IFN-γ+IL-17A+, GM-CSF+, and IL-17A+GM-CSF+CD4+ T cells in the spleens of WT and Mir92a–/– mice at peak EAE (n = 5–6). PE-Cy7, phycoerythrin/cyanine7. (I) Representative flow cytometric plots and frequencies of Foxp3+ Tregs in the spleens of WT and Mir92a–/– mice at EAE onset (n = 4). AF647, Alexa Fluor 647. Data are representative of 2 or more independent experiments and indicate the mean ± SEM. *P < 0.05, **P < 0.01, and ***P < 0.001, by unpaired, 2-tailed Student’s t test (A, C, G, and I), Mann-Whitney U test (B), log-rank (Mantel-Cox) test (D), or 1-way ANOVA with Šidák’s multiple-comparison test between WT and Mir92a–/– mice within each condition (H). Rel. exp., relative expression; Freq., frequency; BV421, Brilliant Violet 421.

