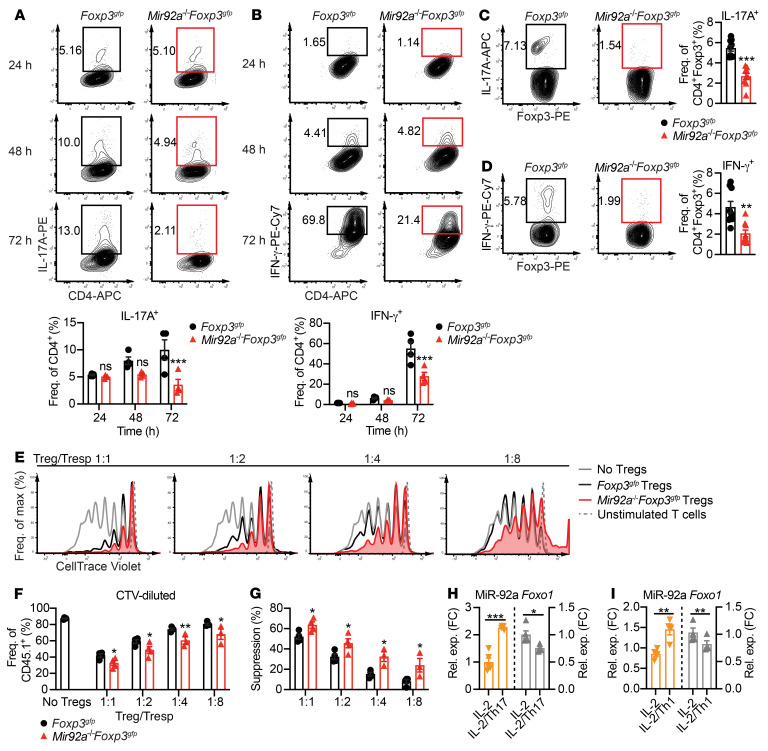
Figure 4. miR-92a promotes Treg acquisition of an inflammatory phenotype and impairs suppressive function.
(A and B) Naive CD4+ T cells from Foxp3gfp and Mir92a–/– Foxp3gfp mice were differentiated in vitro into Tregs and sorted for GFP+ cells, followed by culturing with IL-2 and IL-1β/IL-6/IL-23 (A) or with IL-2 and IL-12/IL-6 (B) for 24, 48, and 72 hours. Representative flow cytometric plots and frequencies of IL-17A+ cells (A) and IFN-γ+ cells (B) are shown (n = 4). (C and D) Representative flow cytometric plots and frequencies of IL-17A+ Tregs (C) and IFN-γ+ Tregs (D) from the spleens of Foxp3gfp and Mir92a–/– Foxp3gfp mice at EAE onset (n = 9–10). (E and F) Foxp3gfp and Mir92a–/– Foxp3gfp mice were immunized with MOG35–55/CFA, and then GFP+ Tregs from dLNs and spleens were sorted at EAE onset and cocultured with CTV-labeled WT CD45.1+ naive CD4+ Tresp cells and APCs. Representative flow cytometric plots (E) and frequencies (F) of CTV-labeled WT Tresp cells at the indicated Treg/Tresp ratios (n = 3–4). (G) Percentage of suppression calculated for the Foxp3gfp and Mir92a–/– Foxp3gfp Tregs in F. (H and I) Naive CD4+ T cells from Foxp3gfp mice were differentiated into Tregs and then sorted for GFP+ cells, followed by culturing with IL-2 alone or IL-2 plus either IL-1β/IL-6/IL-23 (IL-2/Th17) (H) or IL-6/IL-12 (IL-2/Th1) (I) for 24 hours. qPCR analyses of miR-92a (left) and Foxo1 (right) are shown (n = 4–5). Data are representative of 2–3 independent experiments and indicate the mean ± SEM. *P < 0.05, **P < 0.01, and ***P < 0.001, by unpaired, 2-tailed Student’s t test (C, D, H, and I) or 1-way ANOVA with Šidák’s multiple-comparison test between WT and Mir92a–/– mice within each condition (A, B, F, and G).

