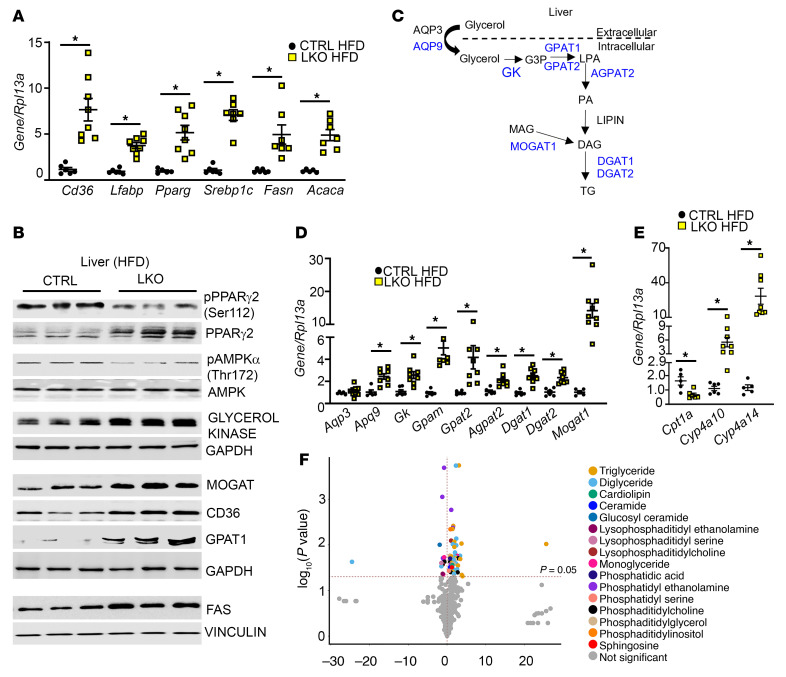
Figure 2. HFD-fed hepatic Kiss1r-knockout mice exhibit increased expression of genes regulating triglyceride synthesis and enhanced liver lipid levels.
(A) Expression of indicated genes by RT-qPCR. (B) Representative Western blots showing expression of indicated proteins. Densitometric analyses of blots and full blots are shown in Supplemental Figure 3. (C) Hepatic triglyceride (TG) synthesis pathway; molecules upregulated in HFD hepatic Kiss1r-knockout (LKO) versus HFD CTRL livers (shown in blue). AQP, aquaporin; GK, glycerol kinase; G3P, glycerol-3-phosphate; LPA, lysophosphatidic acid; PA, phosphatidic acid; DAG, diacylglycerol; MAG, monoacylglycerol. (D and E) Expression of indicated genes by RT-qPCR. (F) Volcano plot showing metabolites by LC-MS in HFD livers (CTRL vs. LKO). Data are shown as the mean ± SEM. Student’s unpaired t test; *P < 0.05 versus respective controls.

