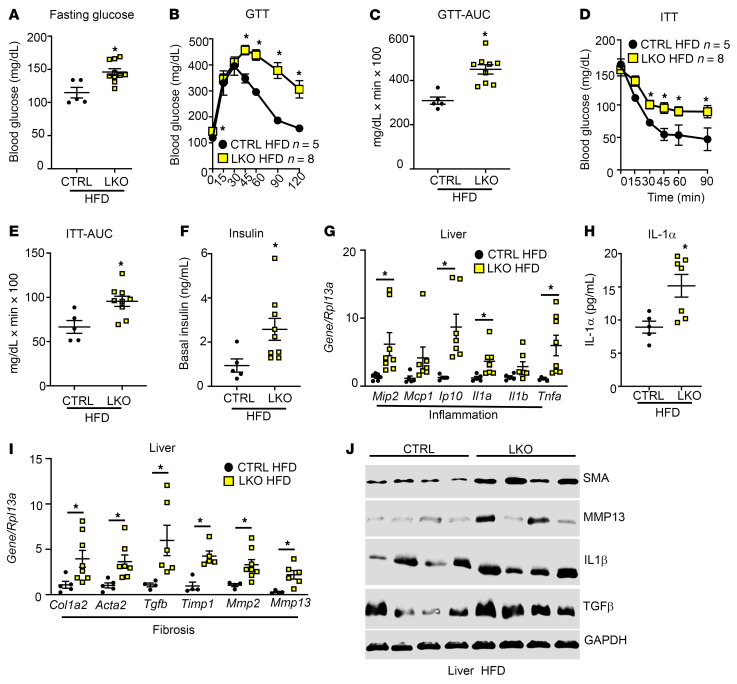
Figure 3. HFD-fed hepatic Kiss1r-knockout mice are glucose intolerant and insulin resistant, and they exhibit increased inflammation and fibrosis markers.
(A) Fasting blood glucose levels. Blood glucose levels during (B) a glucose tolerance test (GTT) and (C) AUC of the GTT as well as (D) an insulin tolerance test (ITT) and (E) AUC of the ITT. (F) Basal insulin levels. (G) Expression of indicated genes by RT-qPCR. (H) Serum IL-1α levels. (I) Expression of indicated genes by RT-qPCR. (J) Expression of indicated protein by Western blot analysis. Densitometry analyses of blots shown in Supplemental Figure 3. Data are shown as the mean ± SEM. Student’s unpaired t test or 1-way ANOVA followed by Dunnett’s post hoc test; *P < 0.05 versus respective controls.

