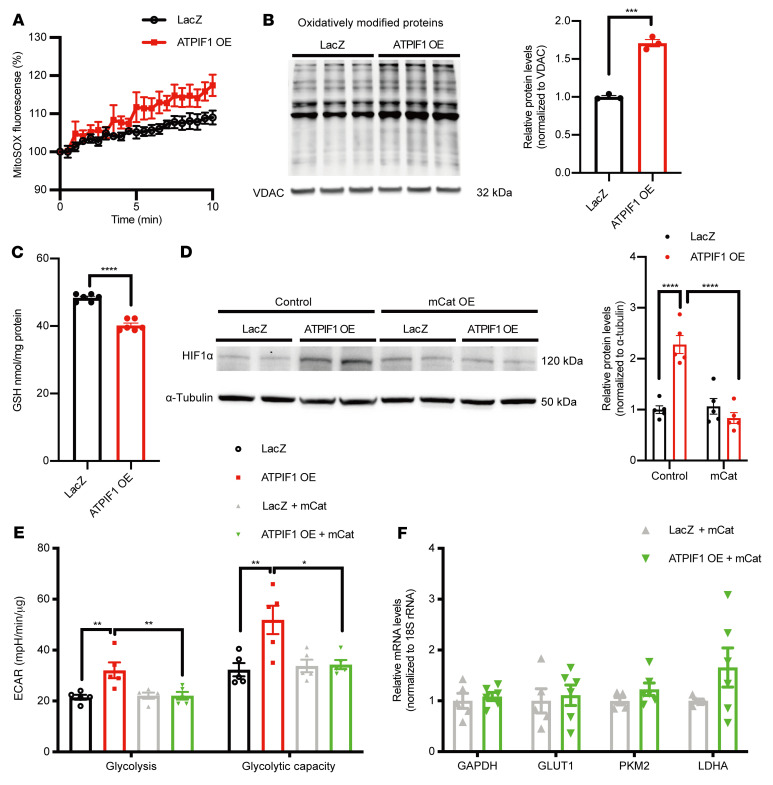
Figure 3. Increased mtROS level was necessary for ATPIF1-triggered HIF1α activation.
(A) Real-time measurement of mitochondrial superoxide production in cardiomyocytes by MitoSOX (n = 4). (B) Immunoblot analysis of protein carbonyls in isolated mitochondria from cardiomyocytes (n = 3). (C) Quantification of glutathione (GSH) levels in the cardiomyocyte lysates (n = 6). (D–F) Representative immunoblot and group average of HIF1α protein level (D, n = 5), ECAR measurement (E, n = 5), and real-time PCR analysis of glycolytic gene expression (F, n = 6) of cardiomyocytes with coexpression of ATPIF1 and mitochondrial catalase (mCat). Gene expression values were normalized to 18S rRNA expression and are shown as relative change over the average of control sets (F). Data are means ± SEM of the values. P values were determined using unpaired 2-tailed Student’s t test (C and F) or 2-way ANOVA followed by Tukey’s multiple-comparison test (D and E); *P < 0.05, **P < 0.01, ***P < 0.001, ****P < 0.0001.

