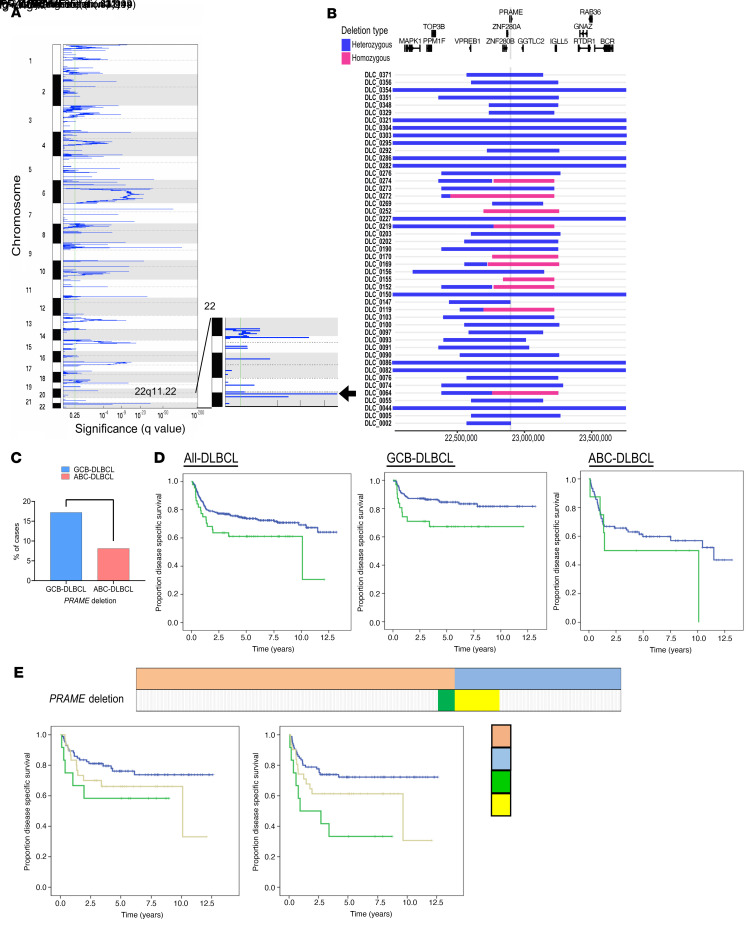
Figure 1. Discovery and clinical impact of PRAME deletion in DLBCL.
(A) Significant focal deletions identified by GISTIC 2.0 analysis (n = 338) and highlighted focal deletion in 22q11.22 region (arrow). (B) Location of focal deletions in the 22q11.22 locus are shown with rectangles. Blue shows heterozygous deletion and red shows homozygous deletions. The location of genes in this region is represented above. (C) Frequency of PRAME deletion between GCB-DLBCL and ABC-DLBCL. A χ2 test was used to compare these frequencies (**P < 0.01). (D) Kaplan-Meier curves represent disease-specific survival according to PRAME deletion status among all-DLBCL, GCB-DLBCL, and ABC-DLBCL. (E) Correlation among Ig-κ, Ig-λ rearrangement, and PRAME deletion status in DLBCL. Cases in green and yellow correspond to Ig-κ rearrangement with PRAME deletion, and cases in light red and light blue correspond to Ig-λ rearrangement with PRAME deletion. Kaplan-Meier curves represent disease-specific survival (left) and time to progression (right) according to Ig-κ, Ig-λ rearrangement, and PRAME deletion status.

