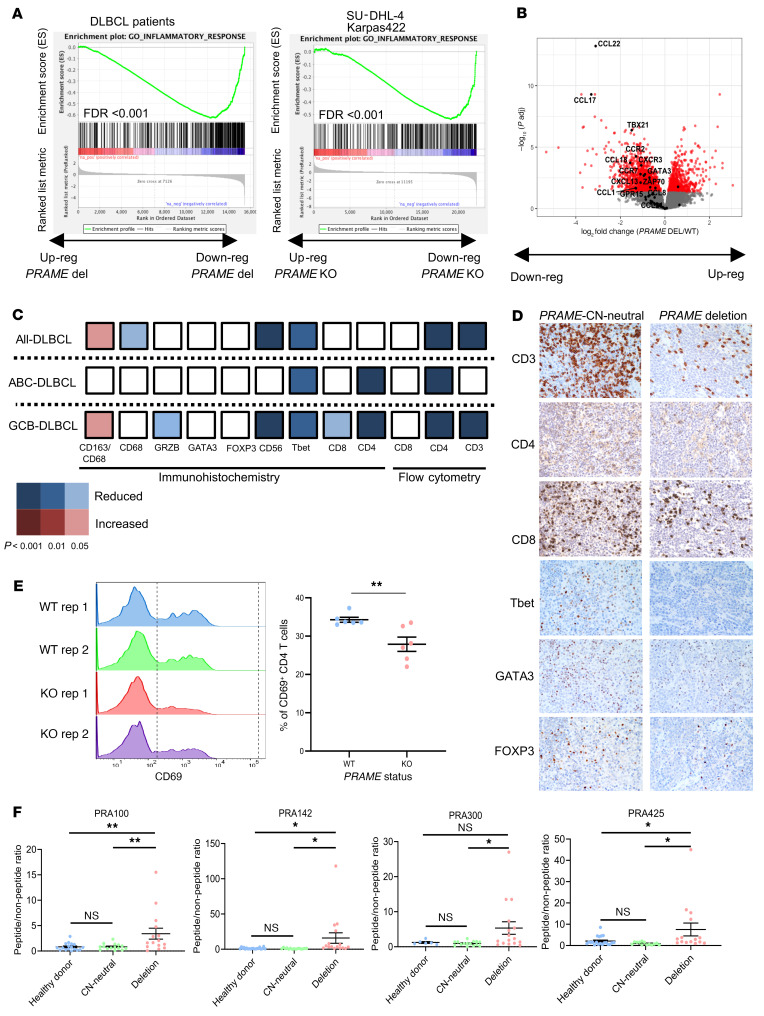
Figure 2. PRAME deletion correlates with immunologically cold TME status.
(A) Preranked GSEA enrichment plots of inflammatory response genes in PRAME-CN-neutral versus PRAME-deleted patient samples (left) and in PRAME-WT versus PRAME-KO cell lines (right). (B) Volcano plot of downregulated and upregulated genes in PRAME-deleted versus PRAME-CN-neutral patient samples. Red dots show genes that are significantly differentially expressed (adjusted P < 0.05), and genes involved in lymphocyte migration are highlighted in black. (C) Validation of TME components using flow cytometry and IHC data in PRAME-CN-neutral versus PRAME-deleted patient samples. (D) Representative IHC figures between PRAME-CN-neutral versus PRAME-deleted patient samples. (E) CD4+ naive T cell coculture with Karpas-422 PRAME isogenic cell line system (left: histogram, right: summary of CD69+CD4+ T cell population). Unpaired 2-tailed t test, mean ± SEM, **P < 0.01. (F) Summary of IFN-γ ELISPOT data of healthy donor, PRAME-CN-neutral, and PRAME-deleted patient derived T cells using 4 peptides (peptide/nonpeptide ratio) (Bonferroni’s multiple-comparison test, mean ± SEM, *P < 0.05, **P < 0.01).

