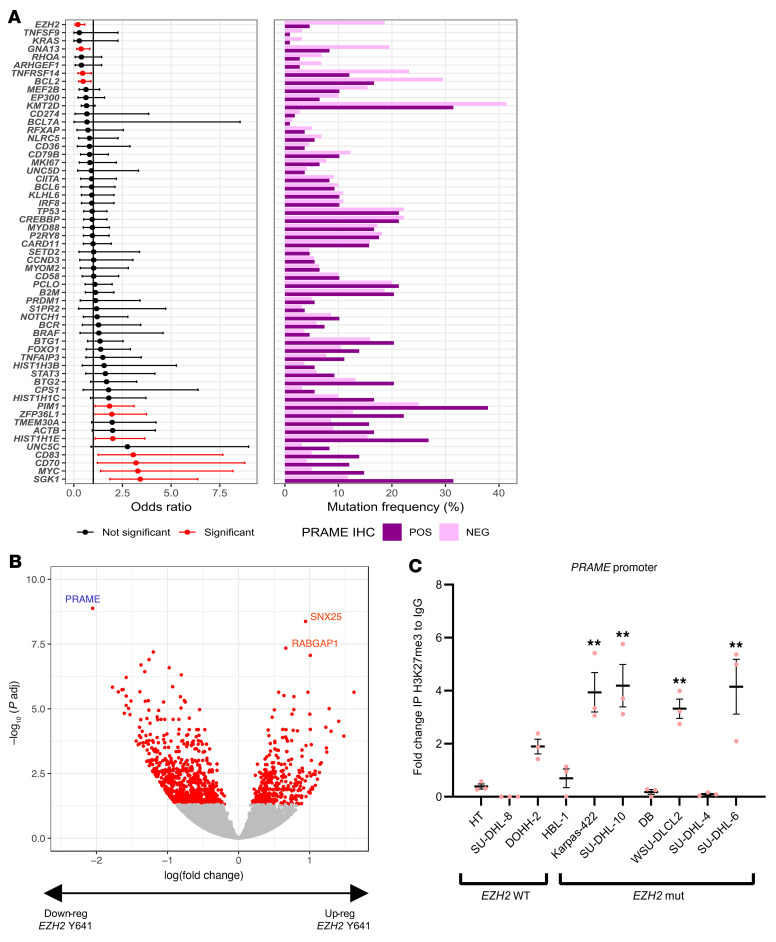
Figure 3. EZH2 Y641 hotspot mutations are significantly enriched in PRAME-negative cases and functionally suppress PRAME expression via promoter binding.
(A) Forest plot shows association with somatic status between PRAME IHC-positive and IHC-negative samples. Red bars indicate statistical significance. The frequency of gene mutations is shown on the right and based on PRAME IHC status. (B) Volcano plot of downregulated and upregulated genes in EZH2-mutated versus WT samples (adjusted P < 0.05). (C) H3K27me3 ChIP quantitative PCR analysis on PRAME promoter region between EZH2-WT cell lines (HT, SU-DHL-8, DOHH-2, and HBL-1) and mutated cell lines (Karpas-422, SU-DHL-10, DB, WSU-DLCL2, SU-DHL-4, and SU-DHL-6). Data were normalized by ACTB (Bonferroni’s multiple-comparison test, mean ± SEM, **P < 0.01).

