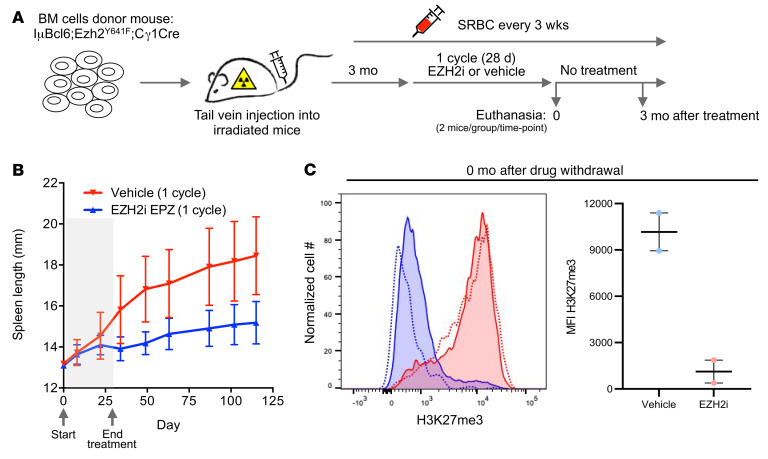
Figure 5. EZH2 inhibition in an Ezh2-mutant in vivo lymphoma model.
(A) Generation of IμBcl6 Ezh2Y641F Cγ1-Cre mice and EZH2 inhibitor treatment. (B) Spleen length change after treatment with vehicle or EZH2 inhibitor. (C) H3K27me3 expression in splenocytes immediately after EZH2 inhibitor treatment. Representative histogram (left) and MFI (right).

