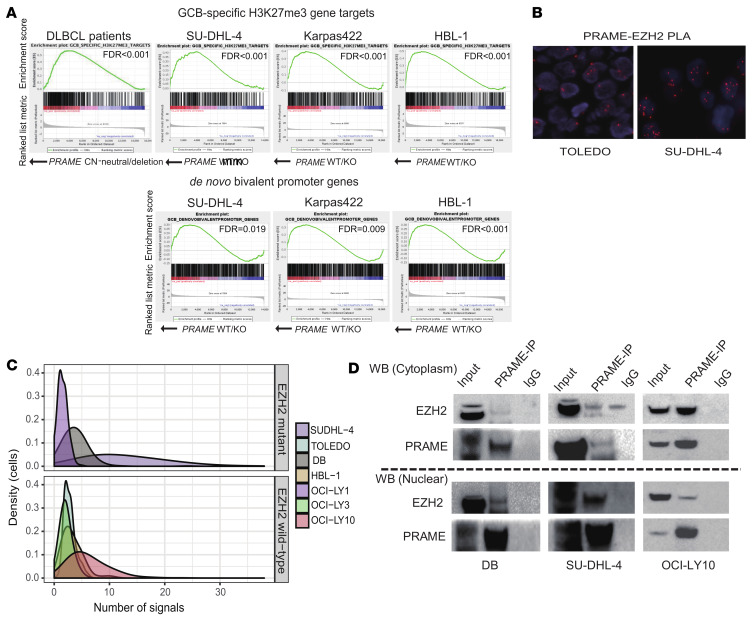
Figure 7. Direct interaction between PRAME and EZH2 and regulated downstream expression programs.
(A) Preranked GSEA for enrichment of H3K27me3 target genes and de novo bivalent promoter genes for PRAME-CN-neutral versus PRAME-deleted samples in DLBCL patient samples and cell lines (SU-DHL-4, Karpas-422, and HBL-1). (B) Representative PLA results in SU-DHL-4 (right) and TOLEDO (left) cells. (C) Summary of PLA results according to EZH2 mutation status. The density of cells (y axis) is shown according to number of PLA signals observed (x axis). (D) Co-IP assay in DB cells (left), SU-DHL-4 cells (middle), and OCI-LY10 (right). Cells were fractionated into cytoplasmic and nuclear components. Upper panel indicates EZH2 immunoblotting, and lower panel indicates PRAME immunoblotting.

