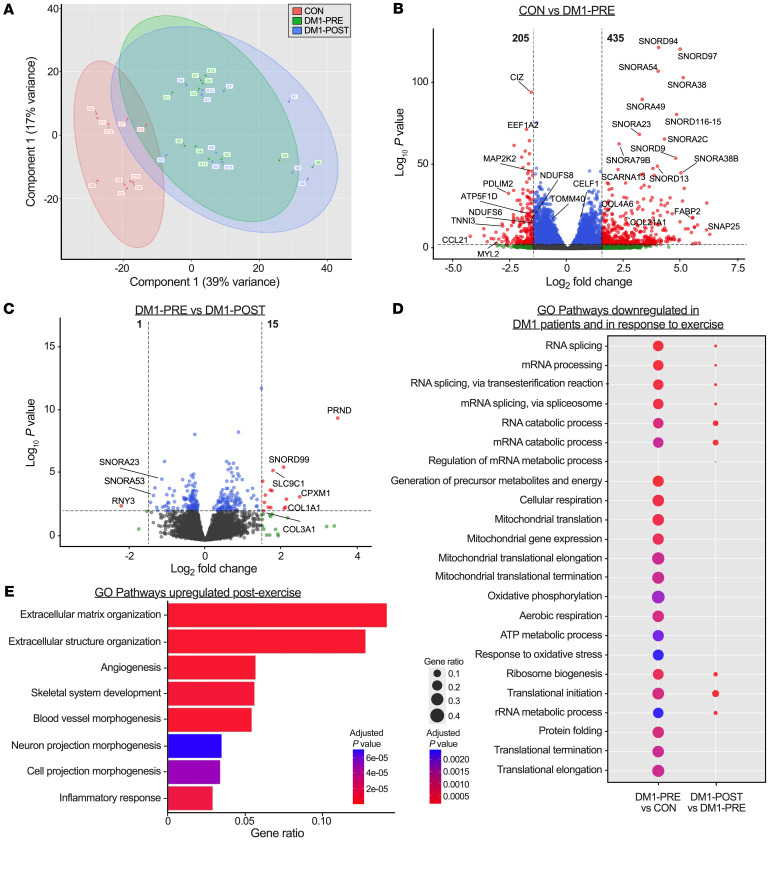
Figure 4. Bulk RNA-Seq reveals a unique transcriptional profile between DM1 patients and healthy CON.
(A) PCA of bulk RNA-Seq for CON (red), DM1-PRE (green), and DM1-POST (blue). (B and C) Volcano plots of differential expression analysis between CON versus DM1-PRE (B) and DM1-PRE versus DM1-POST (C). Significantly different (|log2(FC)| > 1.5, P < 0.005) genes are indicated with red dots, and nonsignificant genes are indicated in blue (|log2(FC)| < 1.5, P < 0.005) and green (|log2(FC)| > 1.5, P > 0.005). (D) Bubble plot of downregulated pathways examined through GO pathway analysis. (E) GO pathway analysis of biological processes upregulated in DM1 patients in response to exercise training. n = 10–11.

