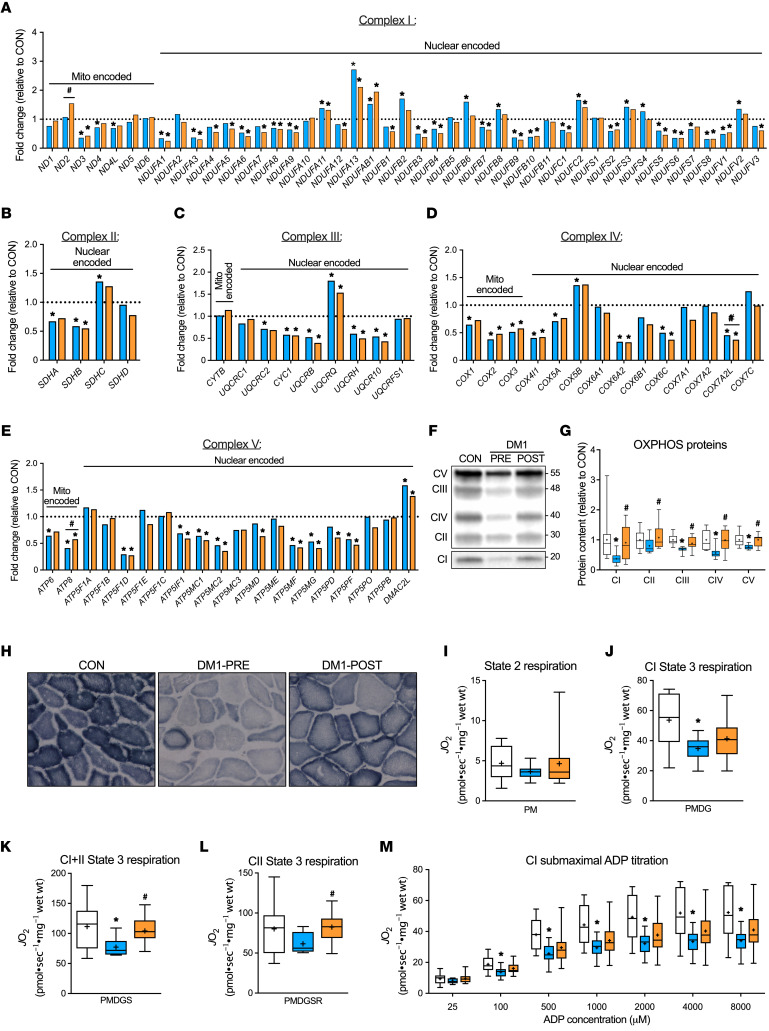
Figure 7. Exercise training ameliorates mitochondrial deficiency in DM1 patients.
Gene expression of all subunits of complex I (A), complex II (B), complex III (C), complex IV (D), and complex V (E) of the mitochondrial electron transport chain expressed as fold change relative to CON and grouped into mitochondrial (left) and nuclear encoded genes (right). (F) Representative Western blot of mitochondrial protein complexes (CI–CV). Full blot was overexpressed and cropped for better visualization of CI. A typical Ponceau stain displayed below demonstrates sample loading. Approximate molecular weights (kDa) shown at right of blots. (G) Graphical representation of CI–CV protein expression. (H) Representative images of succinate dehydrogenase staining. Original magnification, ×20. (I) State 2 complex I (CI) respiration in the presence of pyruvate plus malate (PM). (J) State 3 CI maximal respiration in the presence of PM plus ADP plus glutamate (PMDG). (K) State 3 complex I+II (CI+II) maximal respiration in the presence of PMDG plus succinate (PMDGS). (L) State 3 complex II (CII) maximal respiration in the presence of PMDGS plus rotenone (PMDGSR). (M) Submaximal ADP titration (25, 100, 500, 1000, 2000, 4000, and 8000 μM) curve with PM. Two samples from CON were of poor quality and therefore excluded from the respiration analysis. All respiration experiments were performed in duplicate and averaged for each participant. Data are expressed with bar graphs as mean (A–E) or as box and whisker plots with plus signs representing the mean (G and I–M). n = 9–11. *P < 0.05 versus CON, 1-way ANOVA followed by Bonferroni’s correction; #P < 0.05 versus DM1-PRE, 2-tailed paired t test corrected for multiple comparisons.

