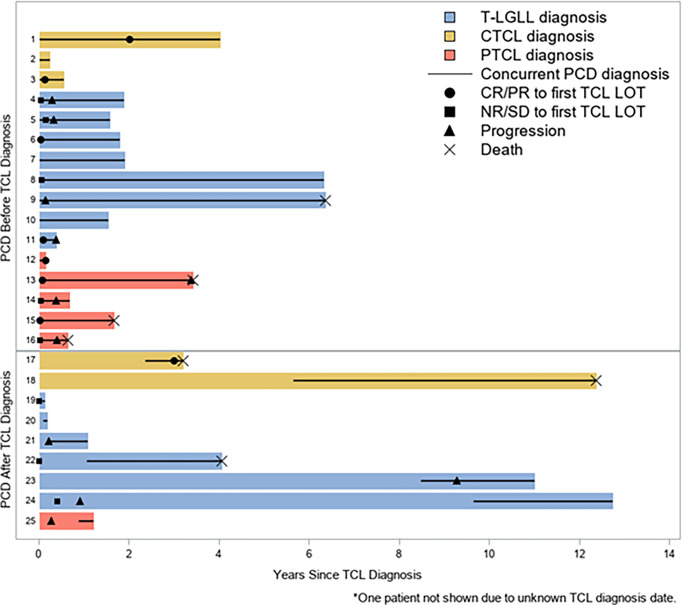
Figure 3.
Swimmer's Plot for Entire Cohort. Swimmer's Plot showing all patients in relation of time of diagnosis of T-Cell Lymphoma (TCL). Patients are split by whether they were diagnosed with T-cell Malignancy or PCD first. Lines on the solid color bars represent concurrent diagnosis. Legend describes when patients had progression or death.

