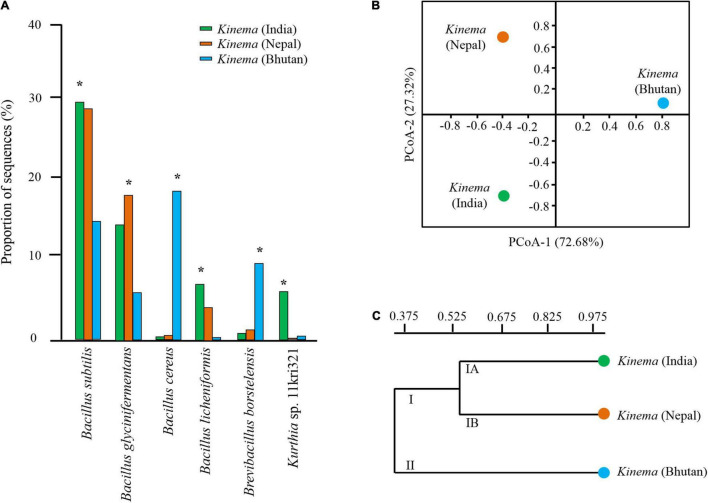
FIGURE 3.
(A) Significant differences* of species abundance with a relative abundance of more than 1% were calculated among samples by a non-parametric Fisher’s exact statistical test. (B) Principal coordinates analysis (PCoA) plot using Bray–Curtis dissimilarity. (C) Unweighted pair group method with arithmetic mean (UPGMA) hierarchical cluster constructed based on species level to observe the differences in the overall microbial structure and diversity in kinema samples collected from different geographical locations.

