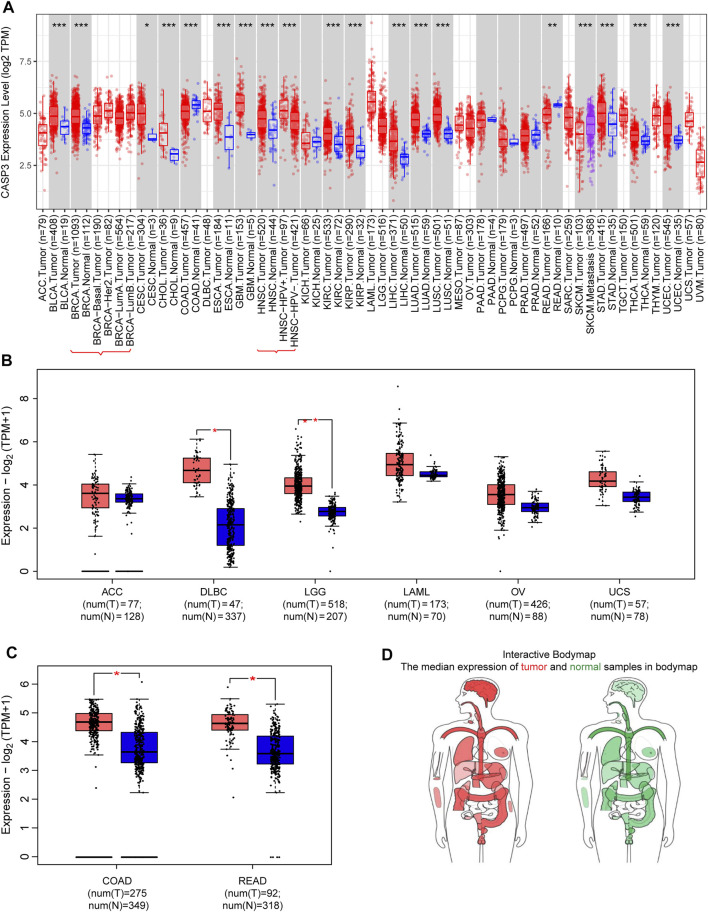
FIGURE 1.
Expression of CASP3 gene in different tumours. (A) Analysis of the expression of CASP3 in different tumours or specific cancer subtypes by TIMER2. *p < 0.05, **p < 0.01, ***p < 0.001. (B,C) For ACC, DLBC, LGG, LAML, OV, uterine carcinosarcoma (UCS), COAD and READ in the TCGA database, the corresponding normal tissues in the GTEx database are used as controls and provided boxplot data. *p < 0.05. (D) map of CASP3 expression in tumours in different parts of the human body by GEPIA2.

