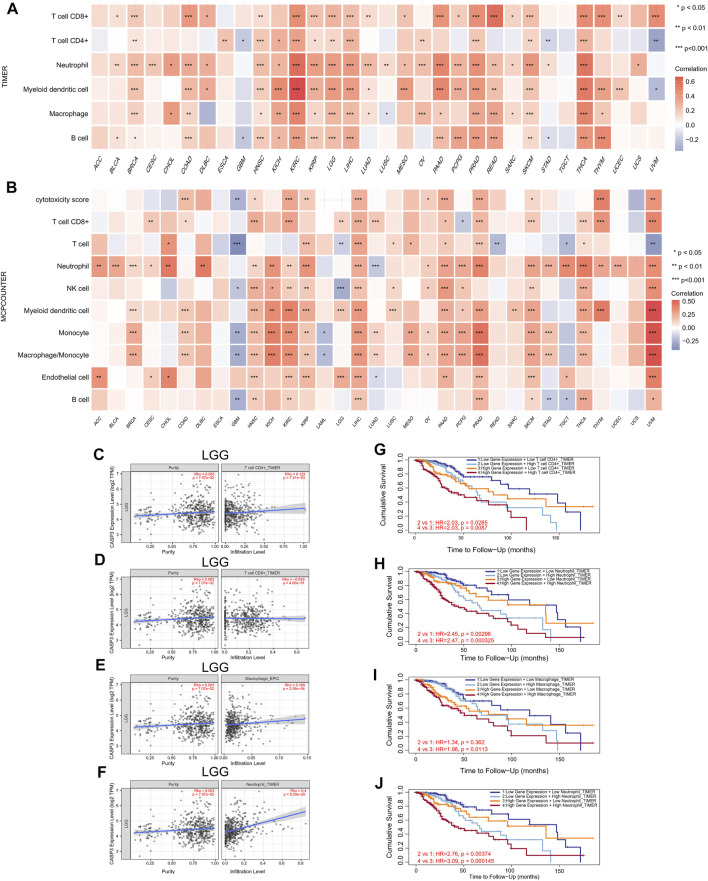
FIGURE 9.
Relationship between the expression of CASP3 and tumour immune cell infiltration. (A) Correlation between expression of CASP3 based on TIMER algorithm and tumour immune cell infiltration. *p < 0.05, **p < 0.01, ***p < 0.001. (B) Correlation between the expression of CASP3 based on MCP-counter algorithm and tumour immune cell infiltration. *p < 0.05, **p < 0.01, ***p < 0.001. (C–F) Relationship between the expression of CASP3 in LGG and the infiltration of immune cells. (G–J) Kaplan-Meier survival analysis of CASP3 expression and the relationship between immune infiltration and OS of LGG.

