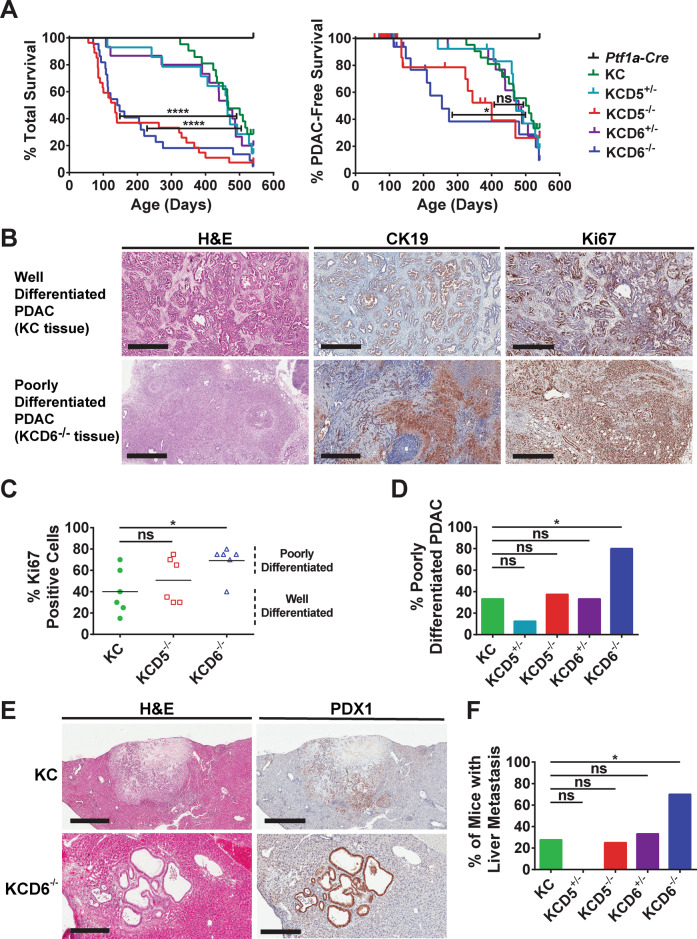
Fig. 5. Loss of DUSP6 drives the accelerated development of highly proliferative, metastatic PDAC.
A Kaplan–Meier curves. Cohorts consisted of the following genotypes: Kras+/+; Ptf1a-Cre; Dusp+/+ (Ptf1a-Cre), KrasLSL-G12D/+; Ptf1a-Cre; Dusp+/+ (KC), KrasLSL-G12D/+; Ptf1a-Cre; Dusp5+/fl (KCD5+/−), KrasLSL-G12D/+; Ptf1a-Cre; Dusp5fl/fl (KCD5−/−), KrasLSL-G12D/+; Ptf1a-Cre; Dusp6+/fl (KCD6+/−) and KrasLSL-G12D/+; Ptf1a-Cre; Dusp6fl/fl (KCD6−/−) Left panel, overall survival n = 12, 21, 14, 27, 15 and 22, respectively. Log-rank test: KC versus KCD5−/− ****p < 0.0001, KC versus KCD6−/− ****p < 0.0001. Right panel, PDAC-free survival n = 12, 0 censored; 21, 3 censored; 14, 3 censored; 27, 17 censored; 15, 3 censored and 22, 11 censored, respectively. The majority of mice were censored due to severe weight loss without PDAC, with the remainder censored due to extra-pancreatic pathologies such as skin wounds and prolapse. Log-rank test: KC versus KCD5−/− ns, KC versus KCD6−/− *p < 0.05. B Representative images of H&E staining (left panels), cytokeratin-19 IHC (CK19, middle panels) and Ki67 IHC (right panels) of either well-differentiated or poorly-differentiated PDAC tissue, taken from tumours in either KC or KCD6−/− mice. (Scale bars, 500 μm.) C Quantification of the percentage of Ki67-positive cells in PDAC tumour sections taken from six mice of the indicated cohorts. Based on morphology, these are designated as either well- or poorly-differentiated tumours. Individual data points and mean are shown, n = 6, ns not significant, *p < 0.05 using one-way ANOVA and Bonferroni post hoc test. D Quantification of the percentage of tumour-bearing mice that displayed poorly-differentiated PDAC of the indicated cohorts. E Representative images of H&E staining and PDX1 IHC of liver metastases presented by KC or KCD6−/− mice. (Scale bars, KC, 800 μm and KCD6−/− 300 μm.) F The percentage of mice presenting with PDAC of the indicated cohorts that displayed associated liver metastasis. D, F n = 18, 8, 8, 9 and 10, ns not significant, *p < 0.05 using a 2 × 2 contingency table analysed by Fisher’s exact test with a two-tailed p value.

