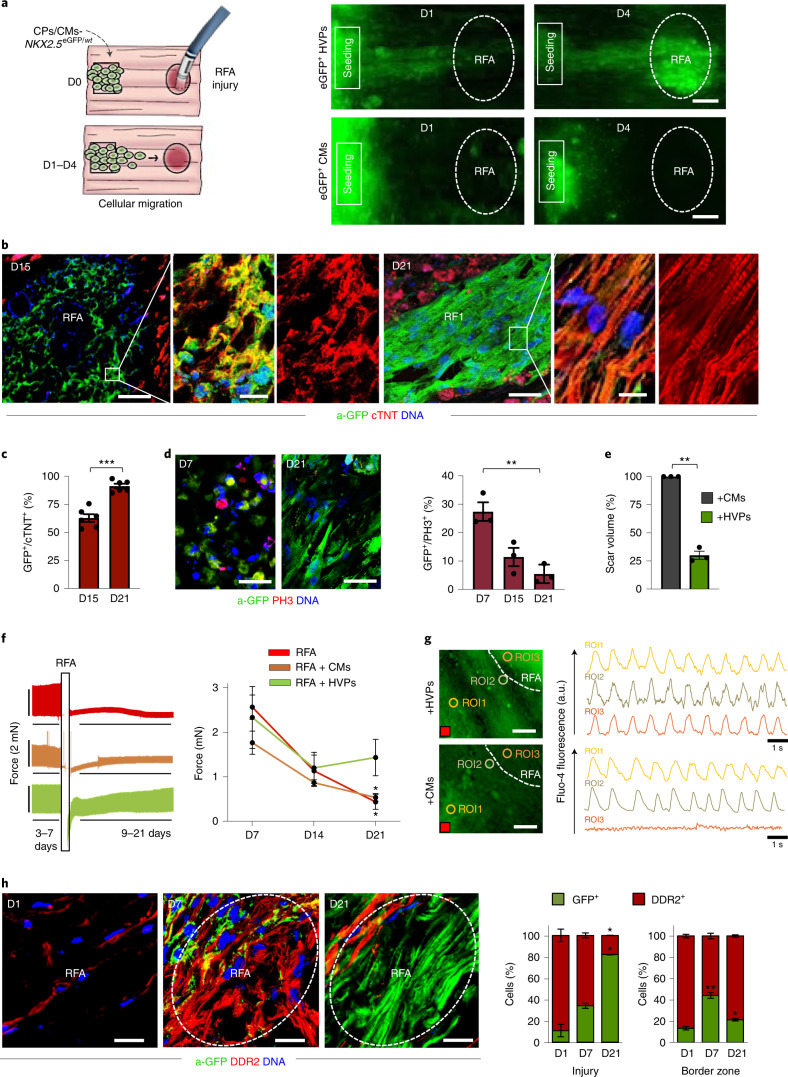
Fig. 3. HVPs show directed migration towards acute cardiac RFA injury and remuscularize the scar.
a, Left: schematic of experimental design for selective seeding of NKX2-5eGFP/wt hESC-derived HVPs or CMs onto bioprinted frame on NHP heart slices and RFA injury on the opposite tissue site. Right: live imaging of eGFP signal on indicated days. Scale bars, 200 µm. b, Representative immunostaining of a-GFP and cTNT in NHP constructs on D15 and D21 after RFA. Magnifications of framed areas are shown in adjacent panels. Scale bars, 200 µm (D15), 100 µm (D21) and 10 µm (magnifications). c, Statistical analysis of GFP+ HVPs expressing cTNT on D15 and D21. Data are mean ± s.e.m. and individual data points; n = 6 biological replicates per timepoint; ***P < 0.001 (t-test). d, Left: immunofluorescence images of proliferating (PH3+) cells on D7 and D21. Right: statistical analysis of PH3+/GFP+ cells on D7, D15 and D21. Data are mean ± s.e.m. and individual data points; n = 3 biological replicates per timepoint; **P < 0.005 (one-way ANOVA). Scale bar, 100 µm. e, Statistical analysis of relative reduction of scar volume with HVPs compared with CMs on D21. Data are shown as mean ± s.e.m. and individual data points; n = 3 biological replicates per group; **P < 0.005 (t-test). f, Left: representative recordings of contractile force before and after RFA, separated by a blanking period of 2 days for re-adjustment of preload. Right: corresponding statistical analysis. Data are shown as mean ± s.e.m.; n = 3 biological replicates per condition; *P < 0.05 versus D7 of the same group (two-way ANOVA). g, Representative images of Fluo-4-loaded NHP-HVP and NHP-CM constructs (left) and corresponding Ca2+ transients at indicated regions of interest (ROI) (right). Scale bar, 100 μm. Red box indicates stimulation point (1 Hz). h, Left: representative immunostaining of a-GFP and DDR2 in NHP constructs at indicated days after RFA. Scale bars, 200 µm. Right: percentage of a-GFP+ and DDR2+ cells at RFA injury or border zone. Data are mean ± s.e.m.; n = 3 biological replicates per timepoint; *P < 0.05, **P < 0.005 versus D1 of corresponding group (two-way ANOVA). For c–f and h, exact P values and numerical data are provided in Source Data Fig. 3.

