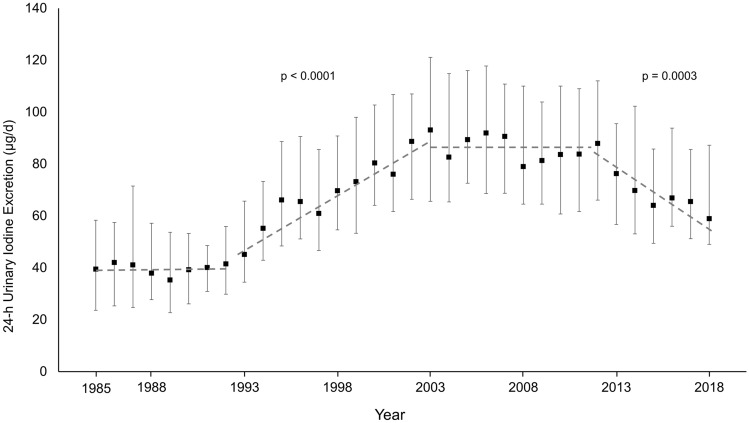
Fig. 1.
24-h urinary iodine excretion of DONALD participants aged 6–12 years from 1985 to 2018 (n = 959 children, 4028 urine samples). Data shown as median and interquartile range; significant time trends during periods 1993–2003 and 2012–2018, not significant during 2004–2011 and 1985–1992. Kruskal–Wallis test over all predefined observation periods of the total time span of 34 years (cross-sectional, balanced design; p < 0.0001) followed by Wilcoxon rank sum tests for comparisons of period 1 vs. 2 (1985–1992 vs. 1993–2003; p < 0.0001), period 2 vs. 3 (1993–2003 vs. 2004–2012; p < 0.0001), and period 3 vs. 4 (2004–2012 vs. 2013–2018; p < 0.0001)

