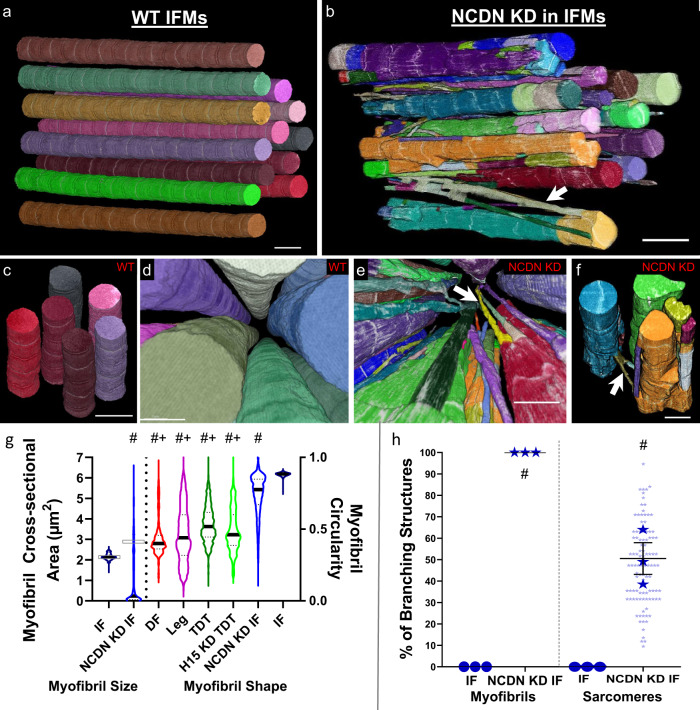
Fig. 4. Loss of NCDN turns on myofibrillar connectivity in fibrillar indirect flight muscles.
a–f 3D renderings of NCDN knockdown (b, e, f) and wild-type (a, c, d) IF muscles showing myofibrillar networks at different angles. g Assessment of myofibril size per myofibril for IF and NCDN KD IF muscles (left) and myofibril shape for tubular muscles, IF, and NCDN KD IF muscles (right). Hash sign (#): Significantly different from fibrillar IF. Plus sign (+): Significantly different from NCDN KD IF (one-way ANOVA, P < 0.05). Gray boxes indicate volume-weighted average. h Percentage of myofibrils with at least one branching sarcomere (left) and percentage of sarcomeres that branch (right) in wild type IF and NCDN KD IF muscles. N values: IF—3 muscle cells, 3 datasets, 114 myofibrils, 982 sarcomeres and NCDN KD IF—3 muscle cells, 2 datasets, 100 myofibrils, 878 sarcomeres. Larger shape symbols represent data from a single cell and smaller shape symbols represent data from a single myofibril. Bars represent muscle cell overall mean ± SE. Hash sign (#): Significantly different from fibrillar IF (two-sided, independent t test, P < 0.01). Scale bars—2 μm.

