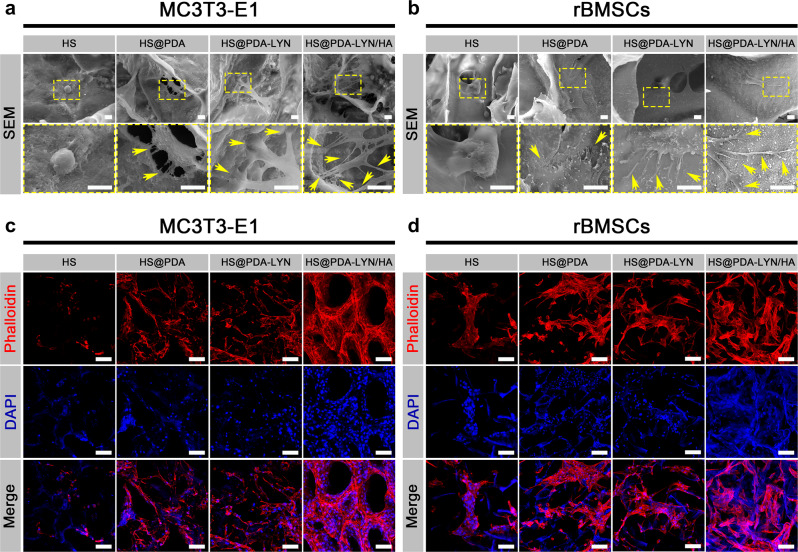
Fig. 4. Cell adhesion, spreading and morphology on different samples.
Representative SEM images of a MC3T3-E1 cells and b rBMSCs cultured on different scaffolds after 7 days. Representative confocal fluorescence images of F-actin (red) and nuclei (blue) in c MC3T3-E1 cells and d rBMSCs cultured on different scaffolds after 7 days. The yellow arrows indicate filopodia of cells adhered to scaffold surfaces. Scale bar in a, b: 10 μm, in c, d: 100 μm.

