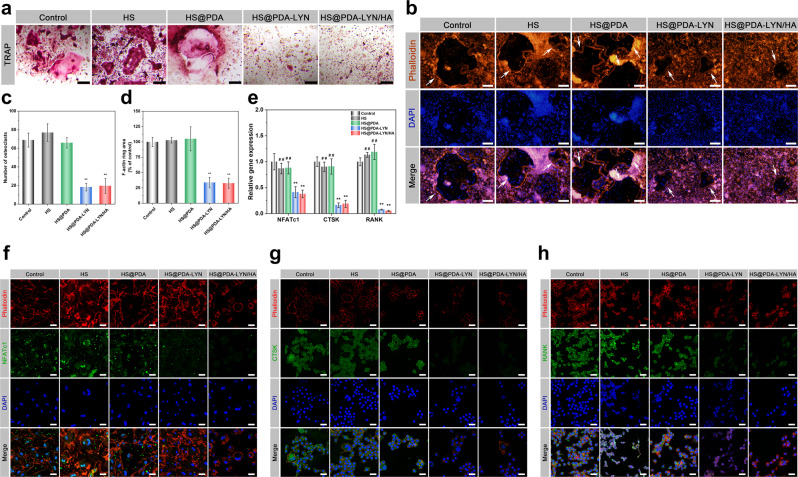
Fig. 6. In vitro osteoclastic differentiation behaviors of BMMs after different treatments.
Representative a TRAP staining and b F-actin ring staining assays for BMMs incubated with different scaffold extracts. The white arrows indicate the representative sealing zone of osteoclasts. Quantitative analysis of c TRAP staining and d F-actin rings in different groups. e The expression of osteoclastogenesis-related genes, including NFATc1, CTSK, and RANK, as determined by qRT–PCR assay. Representative immunofluorescent staining images of f NFATc1 (green), g CTSK (green), and h RANK (green) in BMMs incubated with different extracts. F-actin and cell nuclei were labeled with fluorescent red and blue, respectively. Images were captured using confocal microscopy. This suggested that the newly developed LYN-containing scaffolds may inhibit the osteoclastic differentiation of BMMs by sustaining the supply of LYN. Scale bar in a: 50 μm, in b: 200 μm, in f–h: 25 μm. Data are expressed as the mean ± SD (n = 3). *P < 0.05 and **P < 0.01 indicate significant differences compared with the control group. #P < 0.05 and # #P < 0.01 indicate significant differences compared with the HS@PDA-LYN/HA group.

