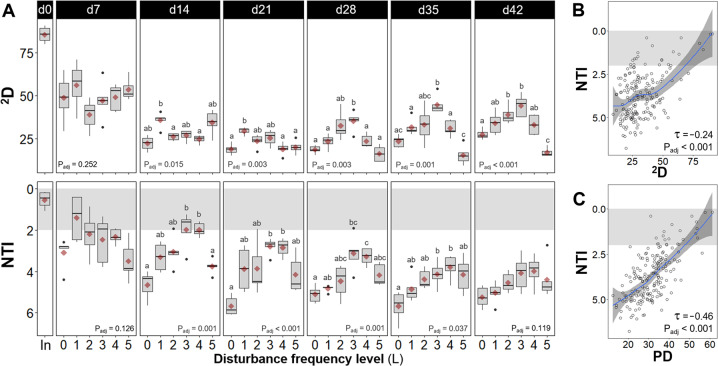
Fig. 1. Community dynamics in α-diversity.
A Community structure assessed via 2nd order Hill α-diversity (2D, upper panels) and community assembly evaluated via the nearest taxon index (NTI, lower panels), from bacterial ASV data for different frequencies of organic loading disturbance (n = 5). Disturbance frequency levels (L): 0 (undisturbed), 1–4 (intermediately disturbed), 5 (press disturbed). In: sludge inoculum (day 0, n = 4). Each panel represents a sampling day, red diamonds display mean values. The box bounds the interquartile range (IQR) divided by the median, and Tukey-style whiskers extend to a maximum of 1.5 times the IQR beyond the box. Characters above boxes display Games-Howell post hoc grouping (Padj < 0.05). Welch’s ANOVA P-values adjusted at 5% FDR shown within panels. Correlations of B 2D and C phylogenetic diversity (PD) vs. NTI from bacterial ASV data across all frequency levels and time points evaluated in this study (m = 184). Kendall correlation τ- and adjusted P-values are indicated within the panel. Blue line represents locally estimated scatterplot smoothing regression (loess) with confidence interval in dark-gray shading. Note the inverted y-axis for NTI, as values closer to zero indicate a higher relative contribution of stochastic assembly. Shaded in gray is the zone of significant stochastic phylogenetic dispersion, |NTI | < 2.

