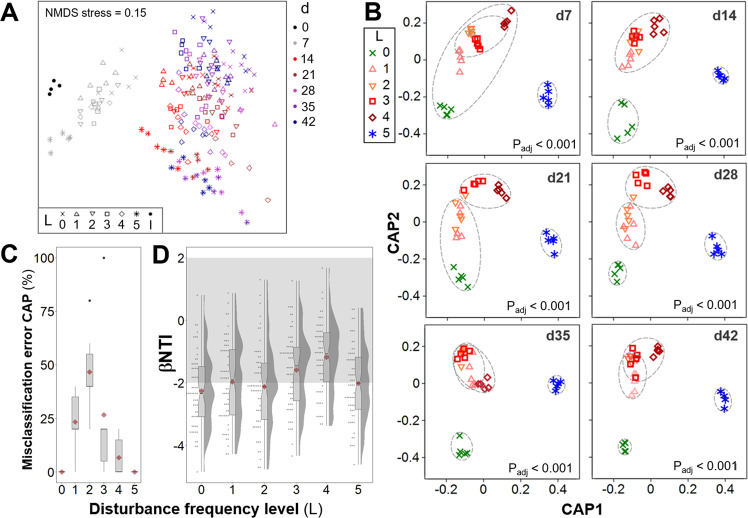
Fig. 2. Temporal dynamics of β-diversity community structure and assembly for bacterial ASV data across different frequencies of organic loading disturbance (n = 5 bioreactors).
A Unconstrained NMDS ordination (weighed Unifrac β-diversity, Hellinger transformed data) for all 184 samples collected. Disturbance frequency levels (L): 0 (undisturbed), 1–4 (intermediately disturbed), 5 (press disturbed). I: Sludge inoculum (day 0, n = 4). B Constrained canonical analysis of principal coordinates (CAP) ordinations (Bray–Curtis β-diversity, squared root transformed data) on different sampling days, including ellipses of 60% group-average cluster similarity and PERMANOVA adjusted P-values. C Misclassification errors at each disturbance frequency level, via the leave-one-out allocation of observations to groups from CAP at each time point after d0 (n = 6 sampling days). Bray–Curtis β-diversity, squared root transformed data. Red diamonds display mean values. The box bounds the IQR divided by the median, and Tukey-style whiskers extend to a maximum of 1.5 times the IQR beyond the box. D Beta nearest taxon index (βNTI) at each disturbance frequency level, from pairwise comparisons across within-treatment replicates at each time point after d0 (n = 60 comparisons). Red diamonds display mean values. Notches show the 95% confidence interval for the median. When notches do not overlap, the medians can be judged to differ significantly. Shaded in gray is the zone where stochastic processes significantly dominate, |βNTI| < 2. βNTI values closer to zero indicate a higher relative contribution of stochastic assembly.

