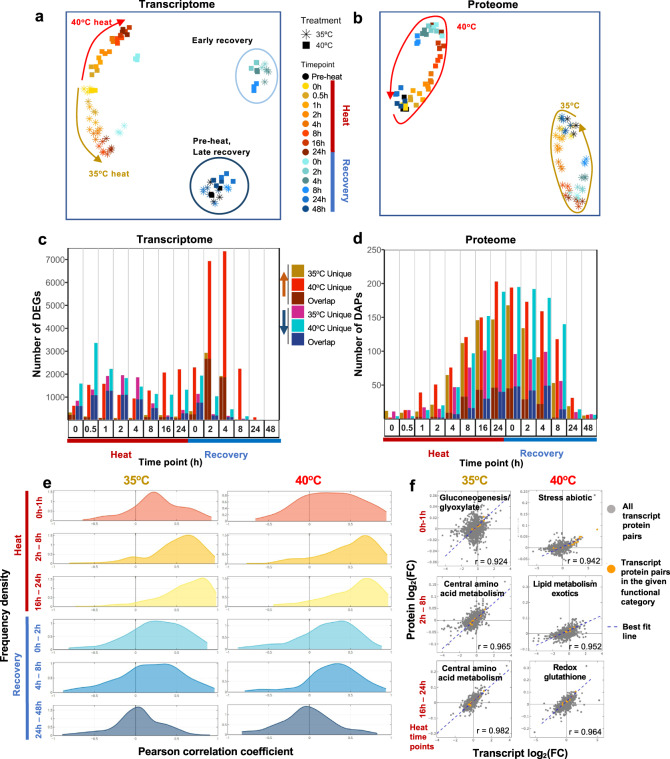
Fig. 2. Transcriptomics and proteomics revealed distinct and dynamic responses during and after heat treatments of 35°C and 40°C.
a Uniform Manifold Approximation and Projection (UMAP) of Transcripts Per Million (TPM) normalized RNA-seq read counts and (b) UMAP of normalized protein intensities. Each data point represents all normalized counts from a single sample. Stars and squares represent algal samples with heat treatments of 35°C or 40°C, respectively. Different colors represent different time points. Brown and red arrows show the movement through time of the 35°C and 40°C treated samples, respectively. c, d Number of unique or overlapping Differentially Expressed Genes (DEGs) and Differentially Accumulated Proteins (DAPs) with heat treatment of 35°C or 40°C at different time points, respectively. Each time point has four bars: the first bar represents genes up-regulated in 35°C, the second represents genes up-regulated in 40°C, the third represents genes down-regulated in 35°C, and the fourth represents genes down-regulated in 40°C. The bottom portion of the stacked bars represents genes/proteins that are differentially expressed in both treatment groups and the top portion represents genes that are uniquely differentially expressed in the given treatment group at that time point. Significant differential expression in transcriptome data was defined as absolute values of log2(fold-change, FC) > 1, false discovery rate (FDR) < 0.05, and absolute difference of TPM normalized read counts between treatment and pre-heat control ≥ 1. Significant differential accumulation of proteins was defined by Dunnett’s FWER < 0.05. e Analysis of correlation between transcripts and proteins revealed overall rising positive correlation during the heat treatment and a decreasing correlation during recovery. The time points were subdivided into three heat (red labels) and three recovery (blue labels) windows for 35°C (left) and 40°C (right) treated samples. The density plots of Pearson correlation coefficients between the fold-changes of transcripts and proteins are shown. X, Pearson correlation coefficient. Y, frequency density. Time points during heat: 0 h, reach high temperature of 35°C or 40°C; 1 h, heat at 35°C or 40°C for 1 h, similar names for other time points during heat. Time points during recovery: 0 h, reach control temperature of 25°C for recovery after heat; 2 h, recovery at 25°C for 2 h, similar names for other time points during recovery. See Supplementary Fig. 7 for more information. f Scatter plots of all transcript-protein pairs at 35°C (left) and 40°C (right) for the three heat time point bins shown in (e). X and Y, transcript and protein log2FC, compared with pre-heat, respectively. Transcript-protein pairs are shown as gray dots. Best fit lines are shown in blue. The Pearson correlation coefficient is shown at the bottom right corner of each scatterplot. Transcript-protein pairs belonging to MapMan functional categories with the highest Pearson correlation coefficient in the given time point bin are shown in orange. See the interactive figures in Supplementary Data 9: transcripts/proteins correlation.

