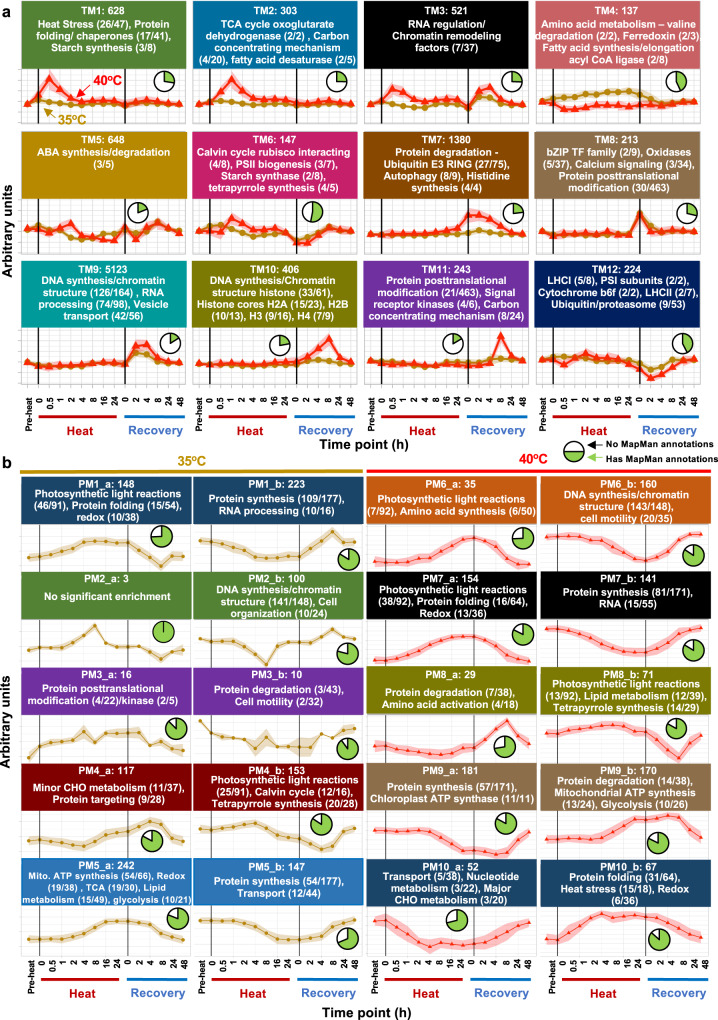
Fig. 3. Transcriptomic and proteomic network modeling revealed differential regulation of key biological pathways with treatments of 35°C or 40°C.
a Weighted correlation network analysis (WGCNA) of transcriptome data identified gene modules with similar expression patterns. TM: transcriptomic module. The z-normalized consensus gene expression patterns for 40°C (red triangle) and 35°C (brown circle) for each module are displayed. b Correlation networks of protein abundance over time courses for 35°C and 40°C heat treatments. PM, proteomic module. For each module, the eigenvectors as aggregated signal shape is depicted. Prominent functional terms that were enriched in the respective module are given for proteins correlating positively (PM_a) or negatively (PM_b) to their corresponding eigenvector (FDR < 0.05). a, b Black vertical lines indicate the start and end of the heat treatment at either 35°C or 40°C. Pre-heat, before heat treatments. Time points during heat: 0 h, reach high temperature of 35°C or 40°C; 0.5 h, heat at 35°C or 40°C for 0.5 h, similar names for other time points during heat. Time points during recovery: 0 h, reach control temperature of 25°C for recovery after heat; 2 h, recovery at 25°C for 2 h, similar names for other time points during recovery. The y axes are in arbitrary units. Background shading indicates consensus expression pattern ± sd of eigenmodule members. The number at the top of each facet (e.g., TM1: 628, PM1_a:148) represents the total number of genes/proteins significantly associated with the given module (ANOVA, FDR < 0.05, genes/proteins can only belong to a single module). Select statistically significantly enriched MapMan functional terms are displayed in each facet. Ratios after each MapMan term (e.g., heat stress, 26/47) represent the number of genes/proteins with the assigned MapMan term in the given module relative to the number of genes/proteins with the assigned MapMan term in our entire dataset. Pie charts show the fraction of genes/proteins associated with the given module that have at least one assigned MapMan functional term (green) relative to those associated with the given module but without MapMan functional terms (white). Full functional enrichment analysis can be found in Supplementary Data 5 and 7.

