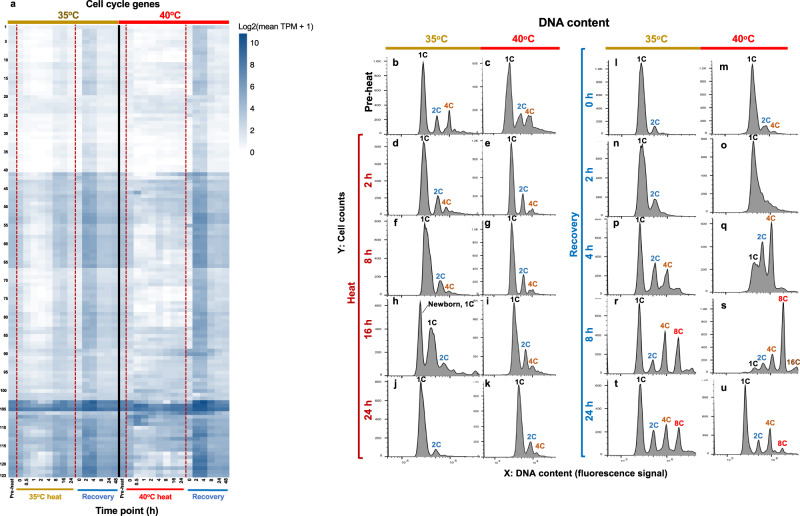
Fig. 4. Heat at 35°C synchronized the cell cycle while heat at 40°C arrested it.
a Expression of cell cycle genes during and after heat treatment of 35°C or 40°C. Genes used for the expression pattern analysis are listed in Supplementary Data 6. Gene expression patterns for treatments of 35°C (left) and 40°C (right) are displayed as log2(mean TPM value + 1). TPM, transcripts per million. Darker blue colors indicate higher expression. Red dashed lines indicate the start and end of the heat treatments. Pre-heat, before heat treatment. Time points during heat: 0 h, reach high temperature of 35°C or 40°C; 2 h, heat at 35°C or 40°C for 2 h, similar names for other time points during heat. Time points during recovery: 0 h, reach control temperature of 25°C for recovery after heat; 2 h, recovery at 25°C for 2 h, similar names for other time points during recovery. b–u FACS (fluorescence-activated cell sorting) analysis of the DNA content in algal samples harvested at different time points before, during, and after heat treatment at 35°C or 40°C. For each figure panel, X axis is DNA content determined by plotting a histogram of fluorescence level (area of the fluorescence channel signal) in log-scale; Y axis is the cell counts in linear scale. DNA copy No. are labeled on top of each corresponding DNA content peak, 1 C (single DNA copy number), 2 C, 4 C, 8 C, 16 C.

