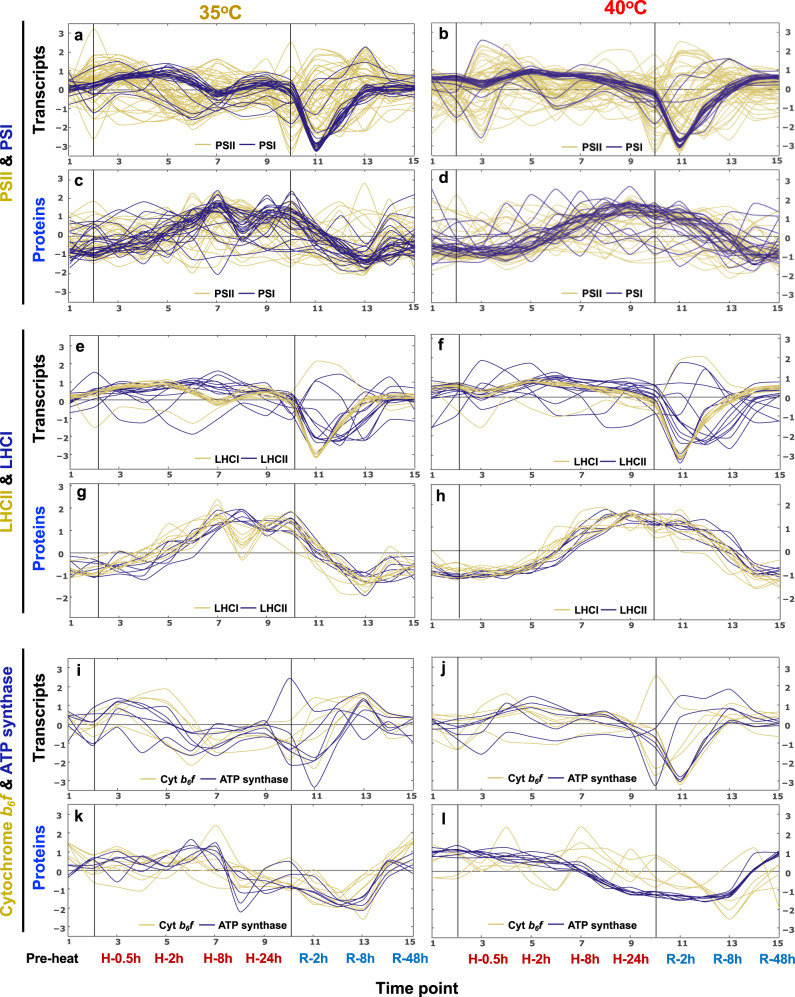
Fig. 6. Transcripts and proteins related to photosynthetic light reactions changed dynamically during and after 35°C and 40°C heat treatments.
Signals of transcripts (a, b, e, f, i, j) and proteins (c, d, g, h, k, l) related to the MapMan bin photosynthetic light reactions, including PSII and PSI (a–d), LHCII and LHCI (e-h), Cytochrome b6f and ATP synthase (i–l), were standardized to z scores (standardized to zero mean and unit variance) and plotted against equally spaced time point increments. The black vertical lines indicate the start and end of heat treatments at 35°C (a, c, e, g, i, k) and 40°C (b, d, f, h, j, l), respectively. Time points are labeled at the bottom. Timepoint 1: pre-heat. Time points 2-9, heat treatment at 35°C or 40°C, including reaching high temperature (0), 0.5, 1, 2, 4, 8, 16, 24 h during heat; time points 10–15, recovery phase after heat treatment, including reaching control temperature (0), 2, 4, 8, 24, 48 h during recovery. See the interactive figures with gene IDs and annotations in Supplementary Data 10 (transcript/protein dynamics), the groups of PS.lightreaction (PS for photosynthesis).

