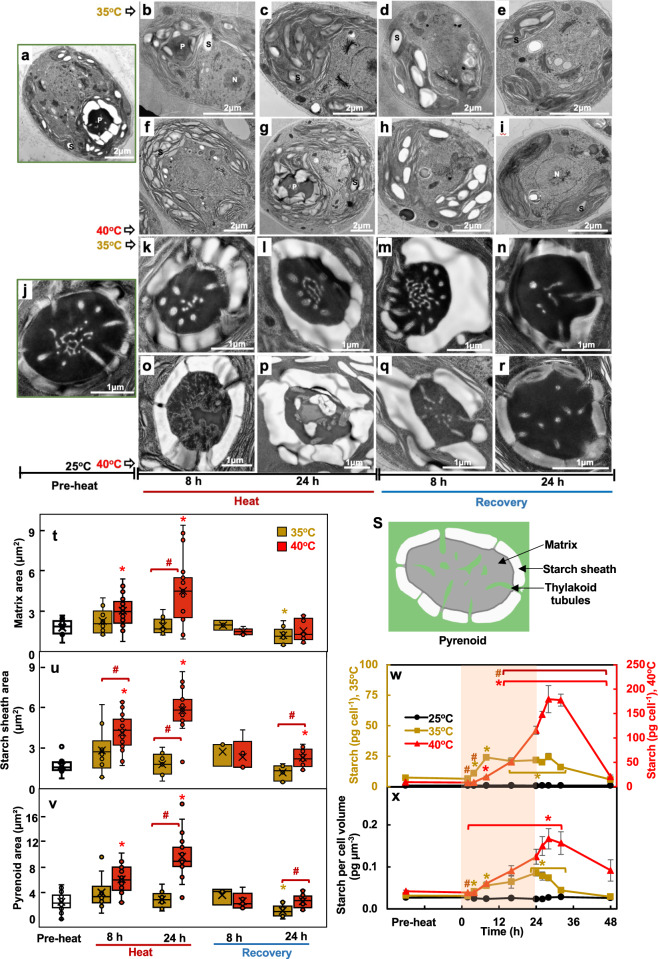
Fig. 9. Only 40°C altered thylakoid and pyrenoid ultrastructure while both 35°C and 40°C treatments stimulated starch accumulation.
a–r Representative transmission electron microscopy (TEM) images of algal cells or pyrenoids at different time points before (a, j), during, and after heat treatment at 35°C (b–e, k–n) or 40°C (f–i, o–r). s Cartoon representation of Chlamydomonas pyrenoid structure. t, u, v Areas of pyrenoid matrix, starch sheath and the whole pyrenoids, respectively, quantified using ImageJ and TEM images from algal samples harvested before, during, and after heat treatments of either 35°C (brown) or 40°C (red) at the indicated time points. The data is presented as boxplot based on Tukey-style whiskers. Median values are represented by the horizontal black lines and mean values by the X sign inside each rectangular box. w, x Starch quantification using starch assay kits. Values are mean ± SE, n = 3 biological replicates. The red shaded areas depict the duration of the high temperature. t–x Statistical analyses were performed using two-tailed t-tests assuming unequal variance by comparing treated samples with pre-heat (t–v) or 25°C at the same time point (w, x) (*, p < 0.05, the colors of asterisks match the treatment conditions), or by comparing samples between 35°C and 40°C at the same time point (#, p < 0.05). (w, x) P values were corrected by FDR.

