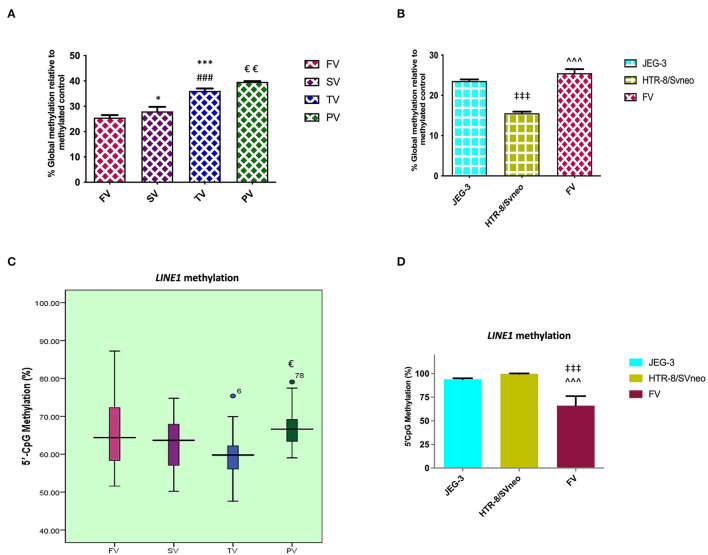
Figure 2.
Percentage of relative global methylation and promoter region methylation for LINE1, (A, B) relative percentage global methylation (A) among different villi samples (B) among different placental cells viz JEG-3, HTR-8/Svneo, and first trimester villi. (C, D) Graphical representation of 5'CpG methylation (%), (C) among different villi samples (D) among different placental cell lines viz JEG-3, HTR-8/Svneo, and first trimester villi. The data are expressed as mean ± SEM. FV, SV, TV, and PV -first trimester, second trimester, third trimester, and preeclampsia placental villi samples respectively. [*p < 0.05, ***p < 0.001 with respect to FV, ###p < 0.001 with respect to SV and €p < 0.05, €€p < 0.01 with respect to TV] [‡‡‡p < 0.001 with respect to JEG-3, ∧∧∧p < 0.001 with respect to HTR-8/SVneo].

