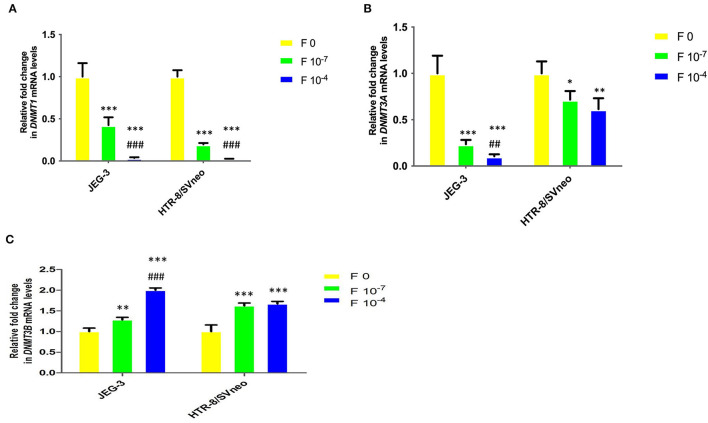
Figure 7.
Relative fold change in mRNA levels of DNMTs upon folic acidsupplementation in JEG-3 and HTR-8/SVneo cells. (A) DNMT1, (B) DNMT3A, and (C) DNMT3B. F0- without folic acid supplementation, F10−7and F10−4 - folic acid supplementation at the concentration of F10−7 and F10−4 M, respectively. The data are expressed as mean fold change ±SEM of three experiments. *p < 0.05, **p < 0.01, ***p < 0.001 with respect to the respective F0 control and ##p < 0.01 and ###p < 0.001 with respect to respective F10-7 treated cells.

