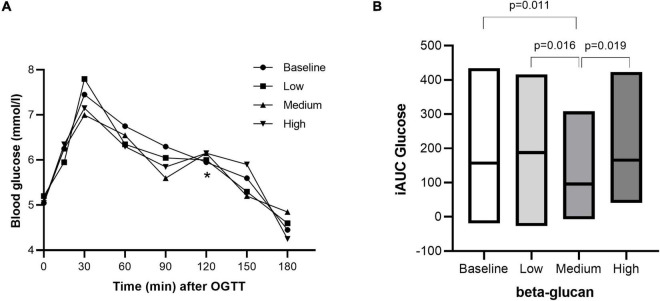
FIGURE 3.
Postprandial blood glucose response after intake of granola with cereal beta-glucan. The postprandial glucose response from 0–180 min (A) and the incremental area under the curve (B) after an OGTT at baseline and after consuming low, medium and high amount of beta-glucan for three days. Data is given as median (25th–75th). Significant differences are calculated with Friedman’s Anova followed by Wilcoxon signed rank test. Significant differences are indicated with * (A) or with a p-value (B).

