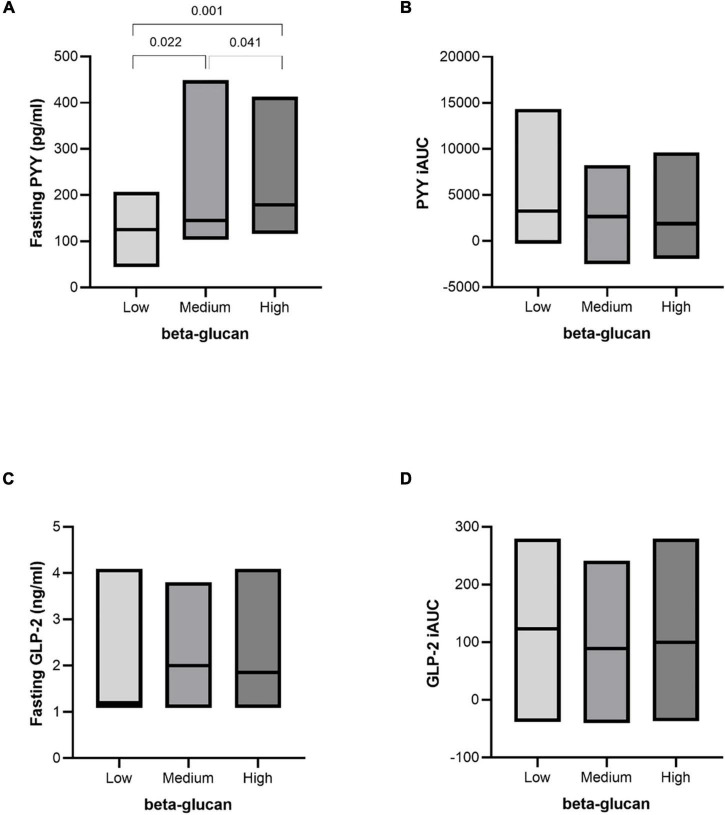
FIGURE 5.
Fasting and postprandial response of PYY and GLP-2 after intake of granola with cereal beta-glucan. Fasting values (A,C) and the incremental area under the curve (B,D) after an OGTT after consuming low, medium and high amount of beta-glucan for three days. Data is given as median (25th–75th). Significant differences are calculated with Friedman’s Anova followed by Wilcoxon signed rank test. Significant differences are presented with p-values.

