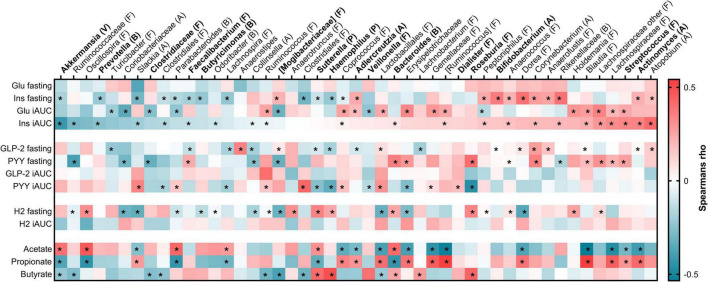
FIGURE 9.
Heatmap of Spearman’s rank correlation coefficient between bacterial taxa and metabolic parameters. The bacterial taxa are sorted from negative (blue) to positive (red) correlation toward insulin iAUC, and those affected by the test meals are indicated in bold. Significant relationship was set to VIP > 1 and indicated by asterisk. No relationship was determined between the bacteria and glucose fasting, GLP-2 iAUC or H2 iAUC. Phyla are indicated within parentheses. A: Actinobacteria; B: Bacteroidetes; F: Firmicutes; Glu: Glucose; GLP-2: Glucagon-like peptide 2; H2: Hydrogen; iAUC: Incremental area under the curve; Ins: Insulin; P: Proteobacteria; PYY: Peptide YY; V: Verrucomicrobia.

