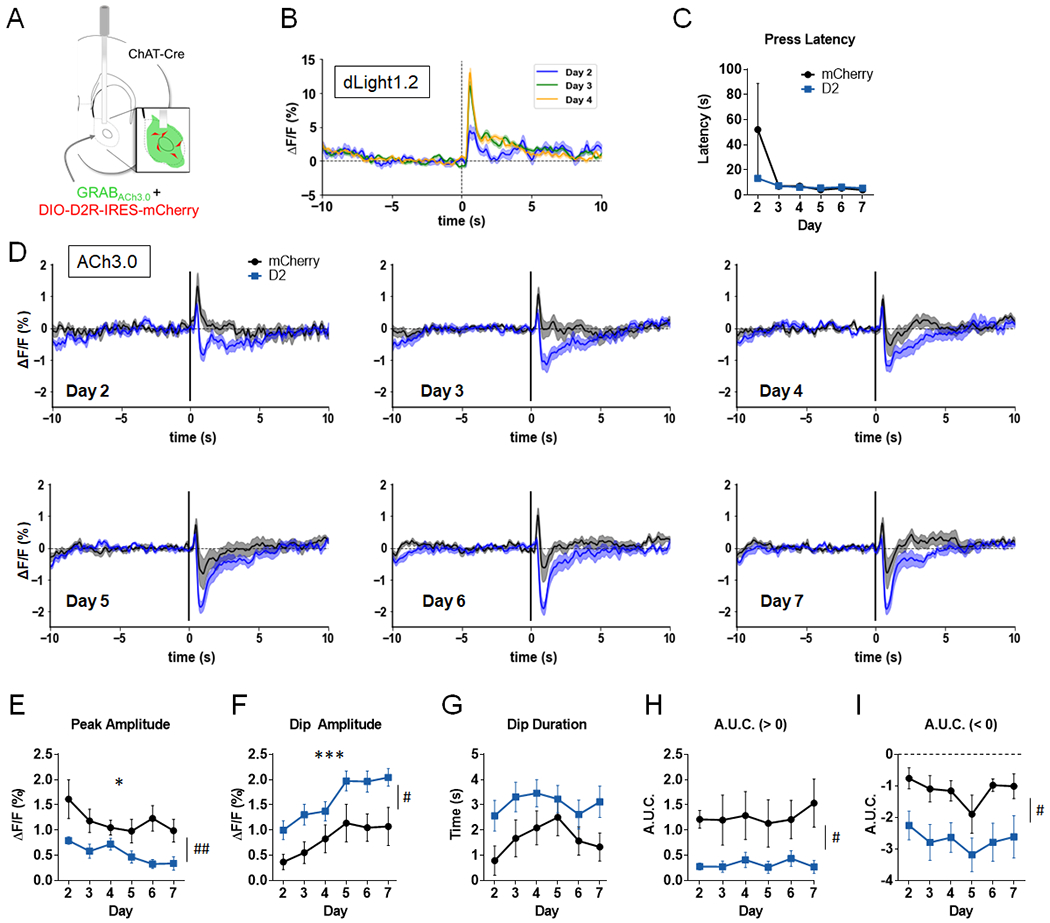
Figure 3. D2R upregulation in NAc CINs alters ACh levels in a continuous reinforcement (CRF) task.

A. AAV-GRABACh3.0 (ACh3.0) was infused together with either AAV-DIO-D2R-IRES-mCherry (or AAV-DIO-mCherry) into the NAc. An optic fiber was implanted to measure task-evoked NAc ACh3.0 fluorescence signals. Inset, representation of expected cell targeting of D2R AAV to NAc CINs (red), with a broader expression of ACh3.0 signal (green). B. Normalized mean dLight1.2 fluorescent signals in NAc of a representative mouse, aligned to the lever extension across 3 days of training on CRF schedule. C. Press latency across days did not differ between the two groups (virus effect: F(1,12) = 0.91, p = 0.36 or virus x day interaction: F(5,60) = 1.14, p = 0.35). D. Normalized mean ACh3.0 fluorescent signals aligned to the lever extension across 6 days of training (Days 2-7; signals were not recorded on the first day of training). E. Peak amplitude was decreased in both groups (day effect: F(5,60) = 3.06, * p = 0.016). Peak amplitude was reduced in D2R-OENacChAT mice (virus effect: F(1,12) = 10.52, ##p = 0.007). F. Dip amplitude increased with training (day effect: F(5,60) = 17.74, ***p = 0.0001). A main effect of virus was also observed (F(1,12) = 6.33, #p = 0.027). G. D2R upregulation lead to a trend towards a longer dip duration (F(1,12) = 4.60, p = 0.053). H. A.U.C. above baseline was significantly reduced by D2R upregulation (F(1,12) = 6.76, #p = 0.023). I. A.U.C. below baseline was increased in D2R-OENacChAT mice (F(1,12) = 9.32, #p = 0.01). n = 7 mice/group for panels C-I.
